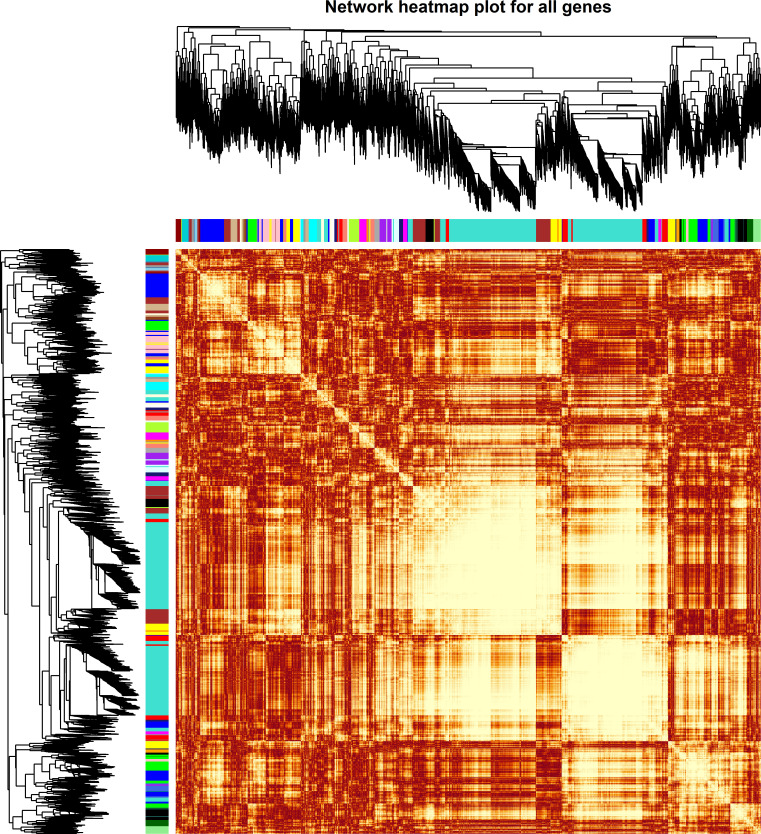
Figure 2.
Weighted differentially expressed (DE) gene network heat map with assigned modules. The gene dendrogram and module assignment are shown along the left side and at the top, where the genes were clustered in the dendrogram with dissimilarity based on topological overlap and the axe colors indicate the different modules. The color intensity inside the heat map represents the overlap degree, where the lighter color represents a low overlap and the darker red color represents a higher overlap.

