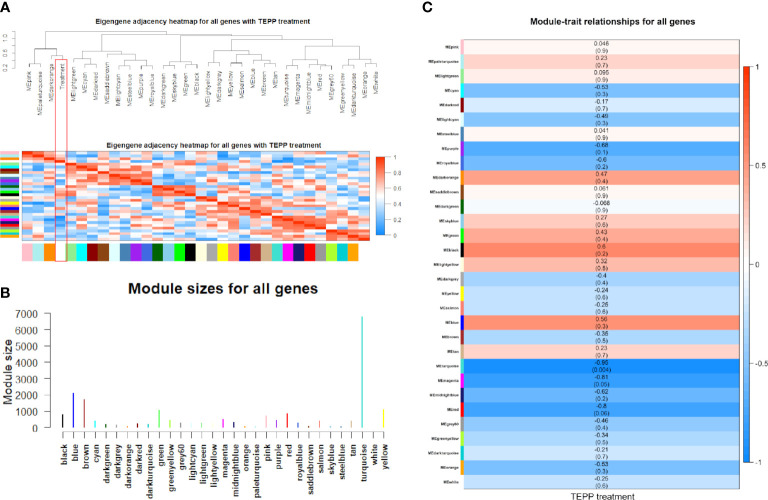
Figure 3.
Co-expressions of differentially expressed (DE) genes. (A) Eigengene dendrogram and adjacency heat map with TEPP-46 treatment (red rectangle). (B) Module sizes (number of genes) in different colors. (C) Module–TEPP relationship heatmap. Each row indicates module eigengenes with the correlation coefficients (P-values in brackets), where red and blue colors represent positive and negative correlations, respectively.

