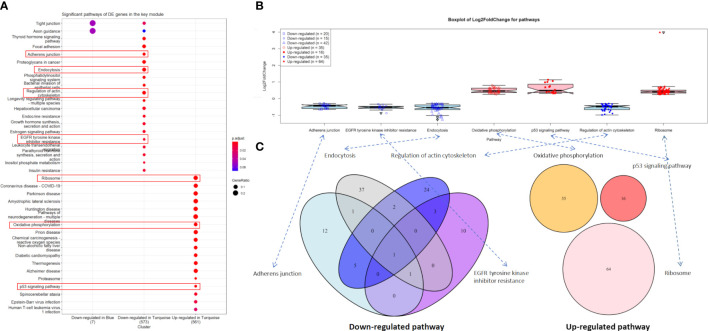
Figure 4.
Significant pathways. (A) Significant pathways for differentially expressed (DE) genes in the turquoise (n = 2,509) and blue modules (n = 141) under the downregulated and upregulated categories. (B) Boxplot of log2(FC) values for endocytosis and p53 signaling pathway. (C) Venn diagram for the enriched DE genes of four downregulated and three upregulated pathways.

