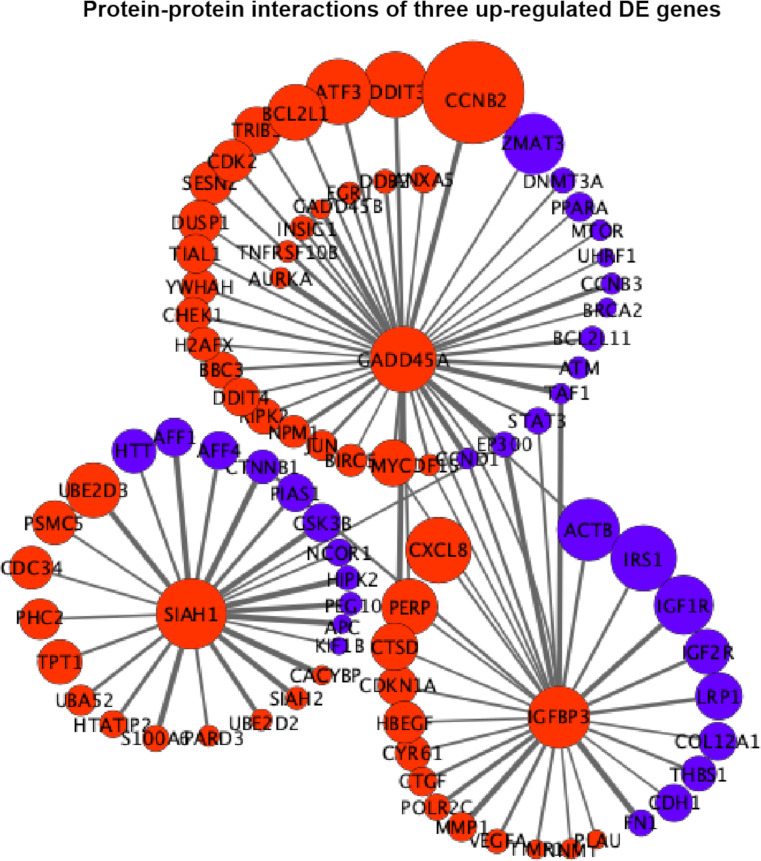
Figure 6.
Protein–protein interaction (PPI) networks of three extremely upregulated differentially expressed (DE) genes (GADD45A, IGFBP3, and SIAH1). The circles indicate the nodes (genes) with the edges that are solid lines indicating the interaction scores of PPIs. The sizes of circles indicate the values of |log2(FC)|, while the red and blue colors indicate the upregulated and downregulated statuses, respectively.

