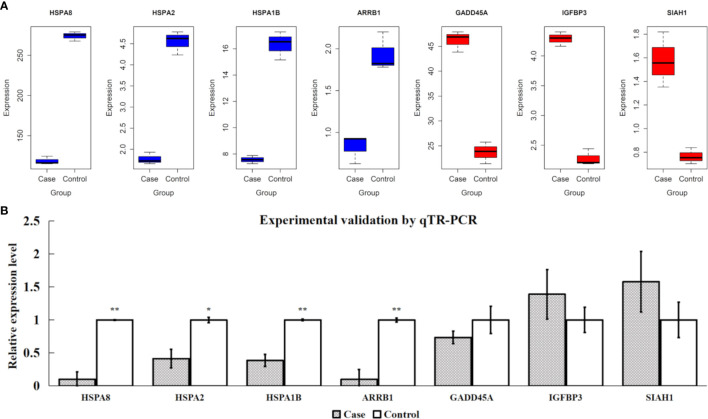
Figure 7.
Validations for four extremely downregulated differentially expressed (DE) genes (HSPA8, HSPA2, HSPA1B, and ARRB1) and three extremely upregulated DE genes (GADD45A, IGFBP3, and SIAH1). (A) Gene expression of FPKM values, where the blue and red colors indicate the downregulated and upregulated genes, respectively. (B) Experimental validations by qTR-PCR. ** and * indicate P-value <0.01 and P-value <0.05, respectively, after Student’s t-test.

