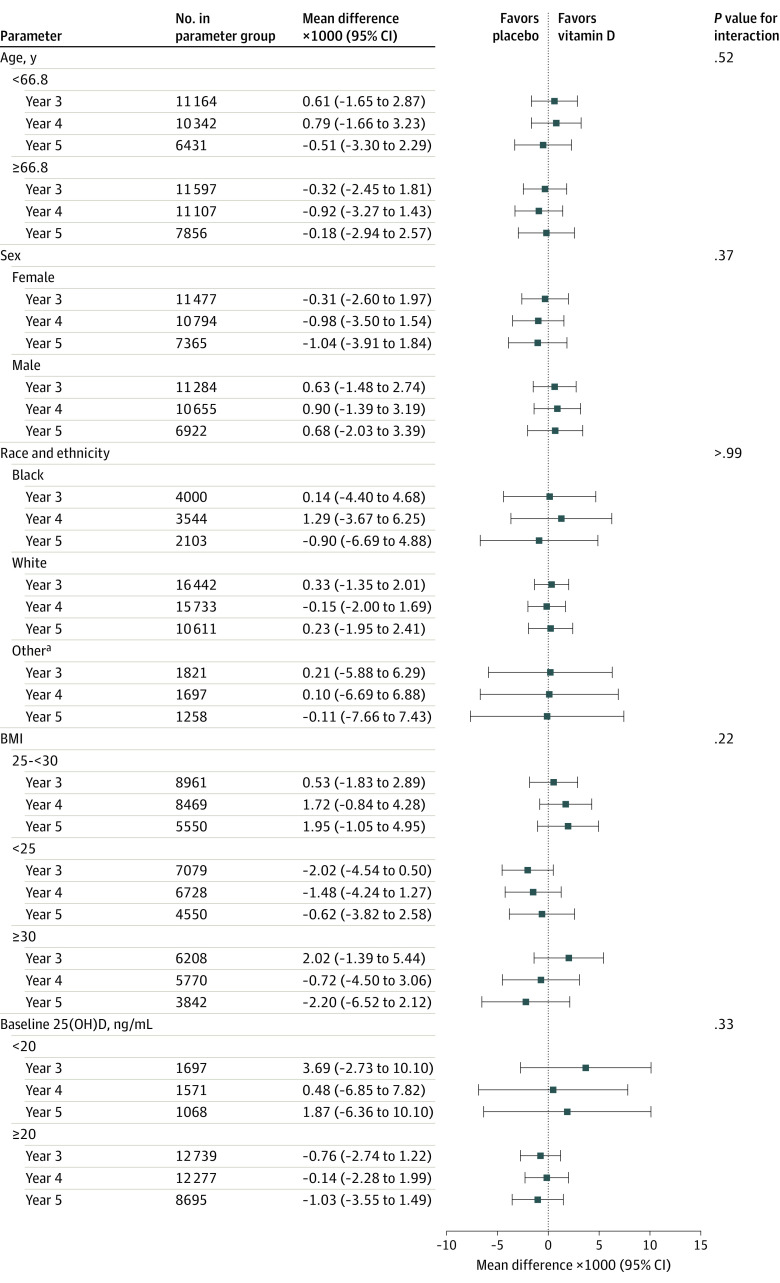
Figure 3. Mean Change in Frailty Score at Each Year Since Randomization According to Vitamin D3 and Placebo Groups by Baseline Subgroups.
BMI indicates body mass index (calculated as weight in kilograms divided by height in meters squared; 25(OH)D, 25-hydroxyvitamin D.
aSelf-reported Asian/Pacific Islander, Native American/Alaskan Native, non-Black Hispanic, and unknown race and ethnicity.

