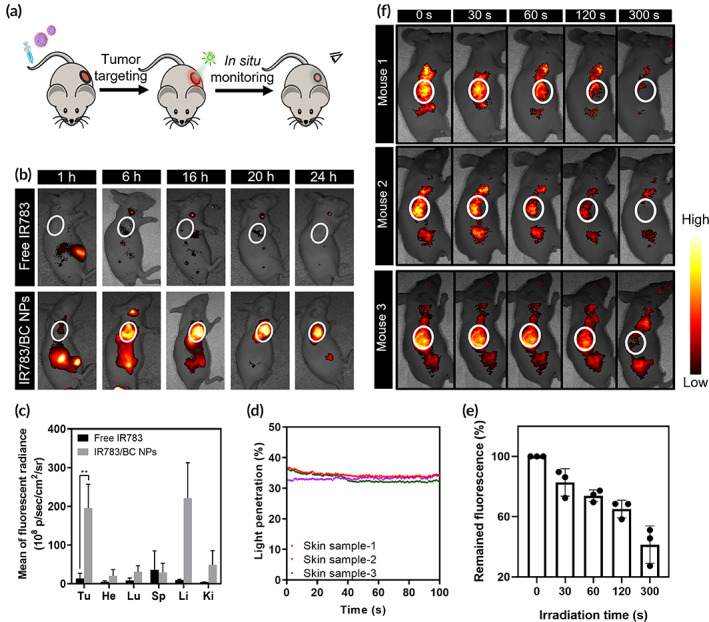
FIGURE 6.

In vivo biodistribution and in‐situ monitoring upon light irradiation. (a) Schematic illustration of the treatment process in HCT116 tumor‐bearing mouse. (b) Representative IVIS fluorescent images of the mice post‐injection of free IR783 or IR783/BC NPs within 24 h (n = 3) (Ex. 780 nm). (c) Quantitative analysis of the biodistribution determined by IVIS in major organs and tumors. Tu, He, Lu, Sp, Li, and Ki represent tumor, heart, lung, spleen, liver, and kidney, respectively. **p < 0.01. (d) Quantitative analysis of the penetration efficiency of 530 nm green light through mouse skin samples (n = 3) within 100 s. (e) Quantitative analysis of fluorescence intensity in the tumor regions exposed to light irradiation for various durations. (f) In‐situ fluorescence imaging of the mice at 24 h post‐injection of IR783/BC NPs with light irradiation at the tumor sites for various durations (n = 3). The tumor sites are marked by white circles. Light irradiation: 530 nm, 100 mW/cm2
