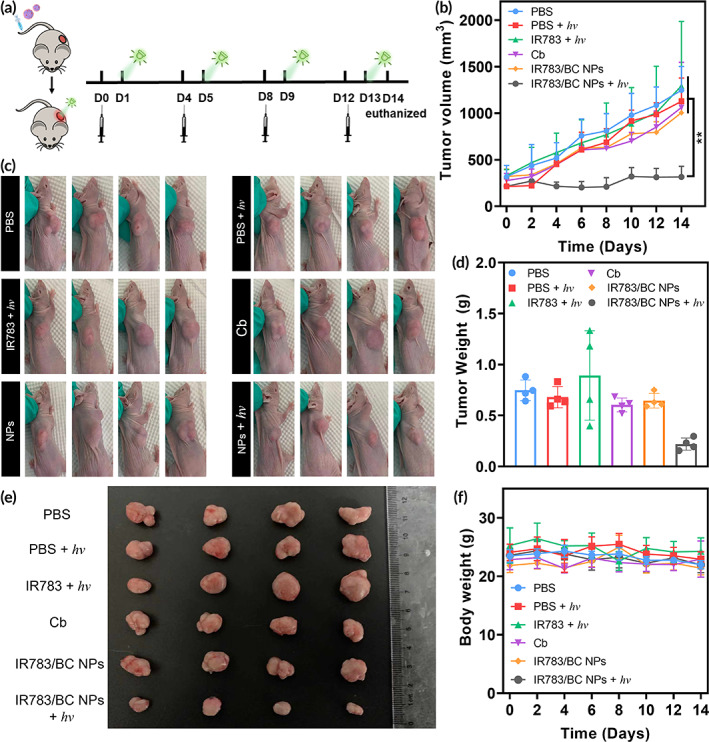
FIGURE 7.

Antitumor efficacy in HCT116 tumor model. (a) Schematic illustrating treatment schedule for inhibiting subcutaneous tumor growth. (b) Tumor volume changes after treatments with PBS, IR783, Cb, IR783/BC NPs, and IR783/BC NPs with light irradiation, separately (n = 4). **p < 0.01. (c) Photos of the mice with subcutaneous tumors, (d) tumor weight, (e) photos of the tumors at Day 14 after different treatments as indicated. (f) Changes in body weight of the mice during the treatments. Light irradiation: 530 nm, 100 mW/cm2, 10 min
