FIGURE 8.

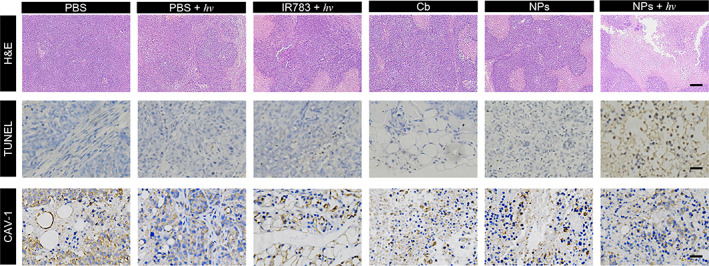
Representative H&E staining, TUNEL staining and immunobiological staining of CAV‐1 protein of the tumor sections. Scale bar: 200 μm (H&E), 50 μm (TUNEL), and 50 μm (CAV‐1). Light irradiation: 530 nm, 100 mW/cm2, 10 min

Representative H&E staining, TUNEL staining and immunobiological staining of CAV‐1 protein of the tumor sections. Scale bar: 200 μm (H&E), 50 μm (TUNEL), and 50 μm (CAV‐1). Light irradiation: 530 nm, 100 mW/cm2, 10 min