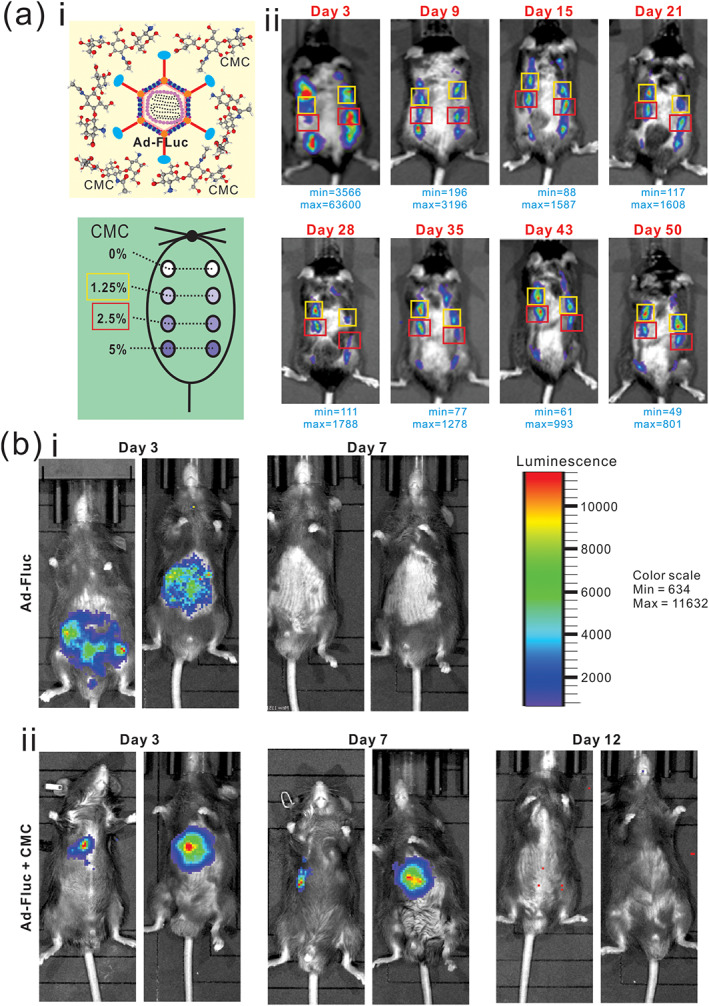
FIGURE 1.

Optimal CMC concentrations prolong adenovirus‐mediated gene expression in vivo. (a) Optimal CMC concentrations for Ad‐FLuc expression after subcutaneous injection. The indicated concentrations (% in wt/vol) of CMC were prepared in 30 μl PBS, and mixed with 1010 infectious units of Ad‐FLuc adenovirus, followed by subcutaneous injections into the flanks of C57BL/6 mice (i). The animals were subjected to whole body Xenogen bioluminescence imaging at the indicated time points after injection (ii). The minimal and maximum signals are indicated for each time point. Representative images are shown. (b) Ad‐Fluc in 30 μl total volume of PBS (FLuc group) (i), or Ad‐FLuc with 1.3% (wt/vol, in PBS) CMC in 30 μl total volume of PBS (FLuc + CMC group) (ii), were intrahepatically injected and the mice were subjected to the whole‐body bioluminescence imaging at Days 3, 7, and 12, respectively. The normalized luminescence color scale is shown in the top right panel. Representative results are shown
