
FIGURE 1.
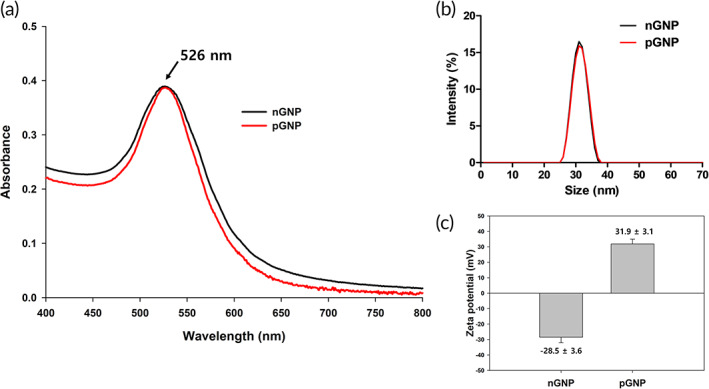
Characterization of negatively charged gold nanoparticles (nGNP) and positively charged gold nanoparticles (pGNP) at 0.1 nM. (a) Absorbance values ranged from 400 to 800 nanometer (nm) for both GNPs. (b) Dynamic light scattering analysis of both GNPs for the measurement of the size distribution. (c) Surface charge measurements for both GNPs using the zeta potential