
FIGURE 8.
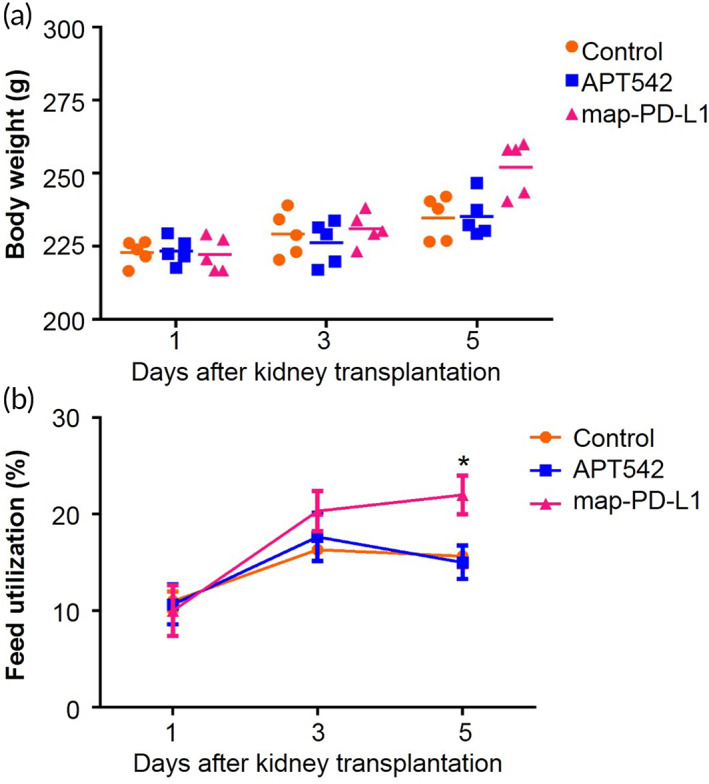
Body weight and feed utilization in transplant recipients. (a) Average body weight of control, APT542 and map‐PD‐L1 groups. (b) Feed utilization of the control, APT542 and map‐PD‐L1 groups. Data are expressed as mean ± SD. *p < 0.05, as determined using a Student's t‐test. map‐PD‐L1, membrane‐anchored‐protein PD‐L1