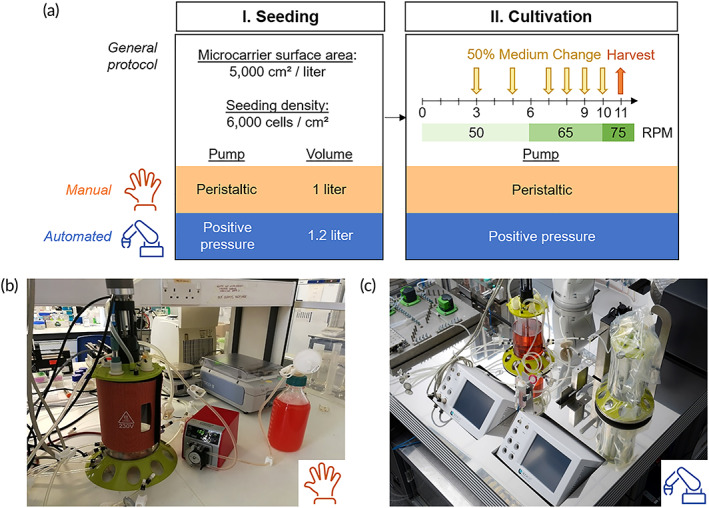
FIGURE 4.

Comparison of manual and automated process protocols. (a) Sequence diagram of the manual and automated processes. The general protocol for the process is described with a comparison of the manual and automated processes. (b) Photographs of the manual bioreactor set up using filtered bottles, peristaltic pump and sterile welder. (c) Automated bioreactor set up within the AUTOSTEM platform, showing the bioreactors connected to the control units and a pumping station using both positive pressure and peristaltic pumps.
