
FIGURE 8.
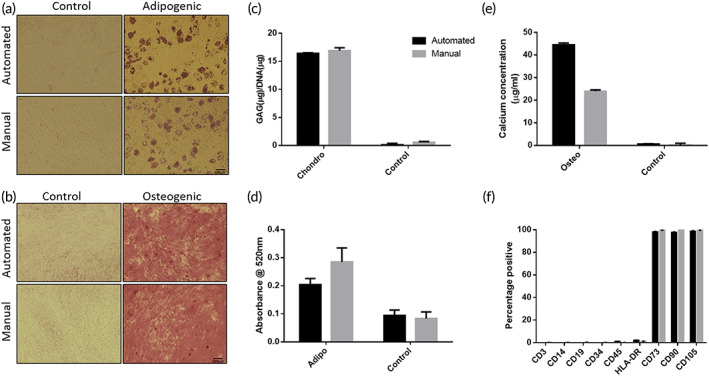
Cell quality assessment postexpansion in the manual and automated bioreactor systems. (a) Oil Red O staining to assess adipogenic differentiation. Scale bars, 200 μm. (b) Alizarin Red staining to assess osteogenic differentiation. Scale bars, 500 μm. (c) GAG/DNA (μg/μg) content for chondrogenic differentiation quantification. (d) Quantification of adipogenic differentiation by extraction of Oil Red O. (e) Quantification of osteogenic differentiation by calcium concentration measurement (μg/ml). (f) Cell surface marker expression assessed by flow cytometry. Data shown as mean ± SD, n = 3.