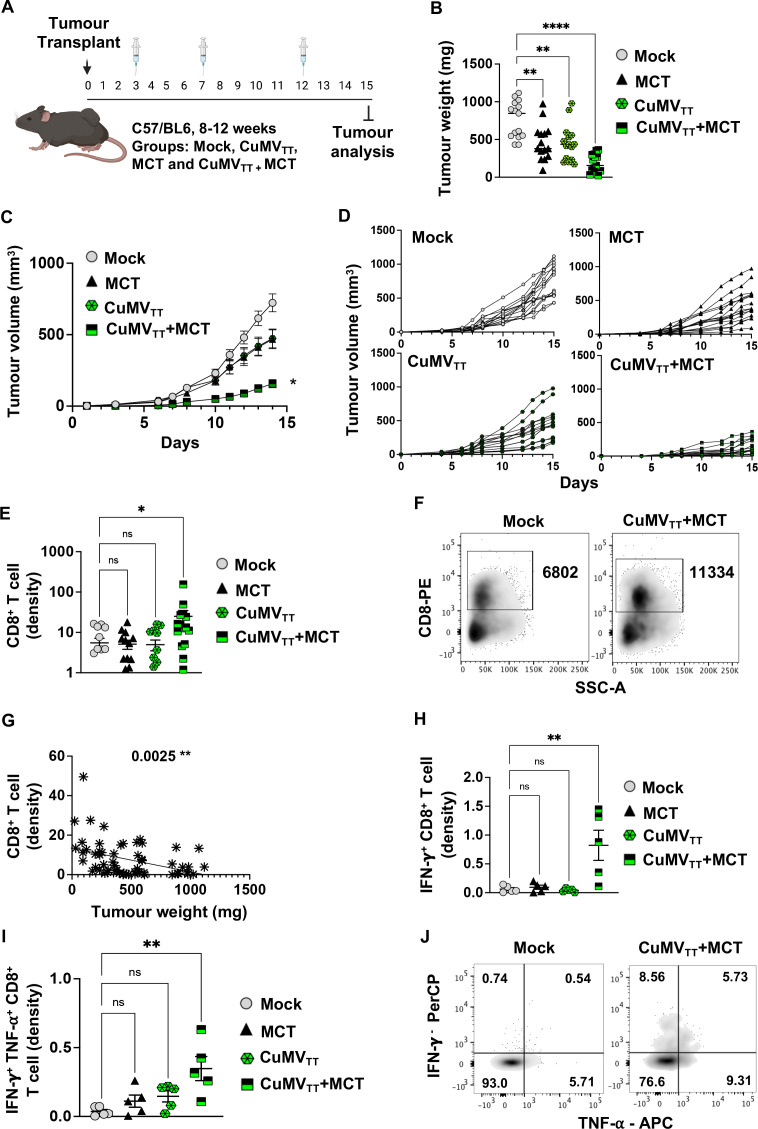
Figure 2.
Administering the novel immune-enhancer intratumorally hinders B16F10 progression. (A) A cartoon illustrating the treatment regimen and the groups of mice treated with intratumoral injections. (B) Tumor weight (mg) measured on day 15 post B16F10 (2 mm3) implantation; each dot represents an individual tumor. Combined (C) and individual (D) tumor growth curves of B16F10 melanoma in the different mouse groups measured by caliper, as tumor volume mm3. (E) Density of CD8+ T cells in tumors as determined by flow cytometry. The densities were determined by dividing the total number of CD8+ T cells in each tumor by the tumor weight (in mg), pregated on TILs. Using FS/SS (F) FACS plots showing the total numbers of CD8+ T cells in a tumor, pregated on TILs. (G) Correlation between density of CD8+ T cells and tumor weight (mg). (H) Density of IFN-γ (I) and IFN-γ/TNF-α producing CD8+ T cells in tumors as determined by flow cytometry upon stimulation with 1 µg /mL PMA/ionomycin. The densities were determined by dividing the total number of CD8+ T cells in each tumor by the tumor weight (in mg). (J) Representative FACS plots showing the total numbers of IFN-γ/TNF-α producing CD8+ T cells in tumors. Statistical analysis (B, C, E, G–I) by ordinary one-way analysis of variance (multiple comparison) (mean±SEM). Statistical analysis in F by simple linear regression. n=12 (B–G) and n=5 (H, I). One representative of two similar experiments is shown. ****p<0.0001; ***p<0.001;, **p<0.01;, and *p<0.05. APC, antigen-presenting cell; IFN-γ, interferon gamma; MCT, microcrystalline tyrosine; ns, not significant; TIL, tumor-infiltrating lymphocyte; TNF-α, tumor necrosis factor alpha.

