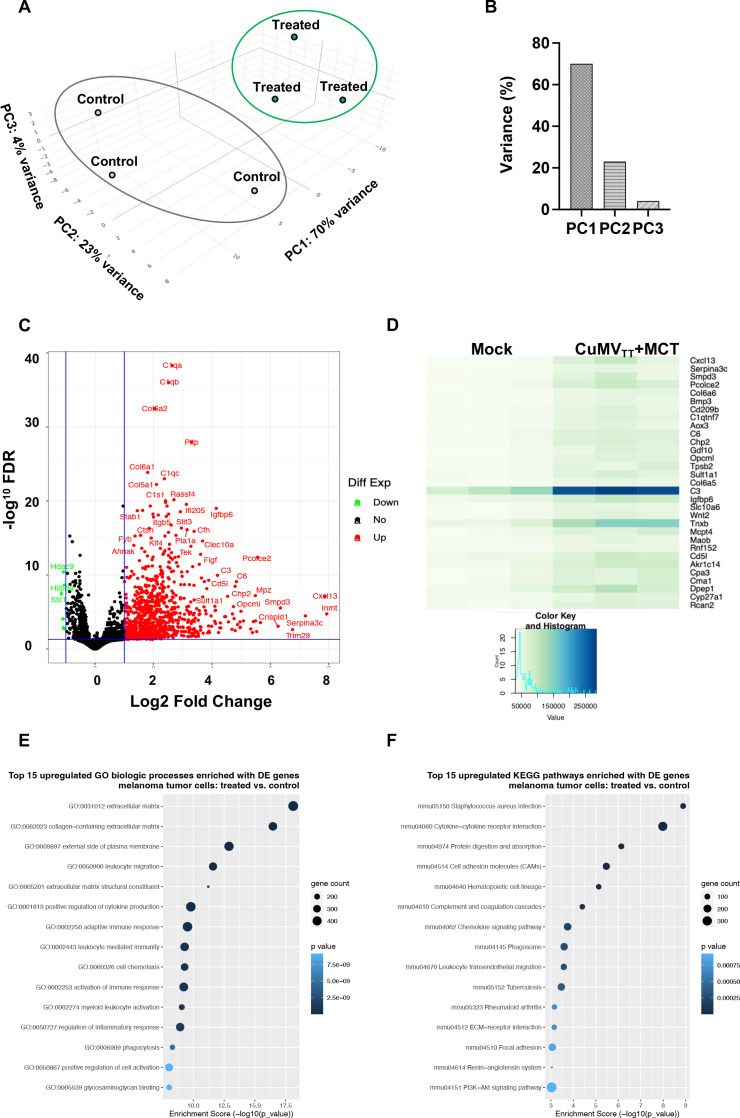
Figure 7.
Transcriptional changes induced by the intratumoral treatment. (A, B)Principal component analysis (PC1, PC2 and PC3—together representing 97% of the variance in the data) of genes differently expressed between the two biological groups (mice with B16F10 tumors treated with immune-enhancer CuMVTT+MCT vs mock group). (C)Volcano plot of differentially expressed genes (treated vs mock). The plot illustrates the log2 fold change threshold and the threshold for p values adjusted for multiple testing (Benjamini-Hochberg procedure). Upregulated genes are presented in red and downregulated in green. (D)Heat map of differential gene expression of mice treated with immune-enhancer versus mock group. RNA-Seq analysis was performed on RNA isolated from triplicate samples for each biological group. (E, F)Analyses of GO and KEGG pathway enrichment were performed to identify biological processes and pathways significantly enriched with upregulated and downregulated genes in tumors for each biological group. Enrichment scores show gene count and statistical significance determined with Fisher’s exact test and presented for the top 15 biological process-related GO terms and the top 15 KEGG pathways. FDR, false discovery rate; GO, gene ontology; MCT, microcrystalline tyrosine; RNA-Seq, RNA sequencing.

