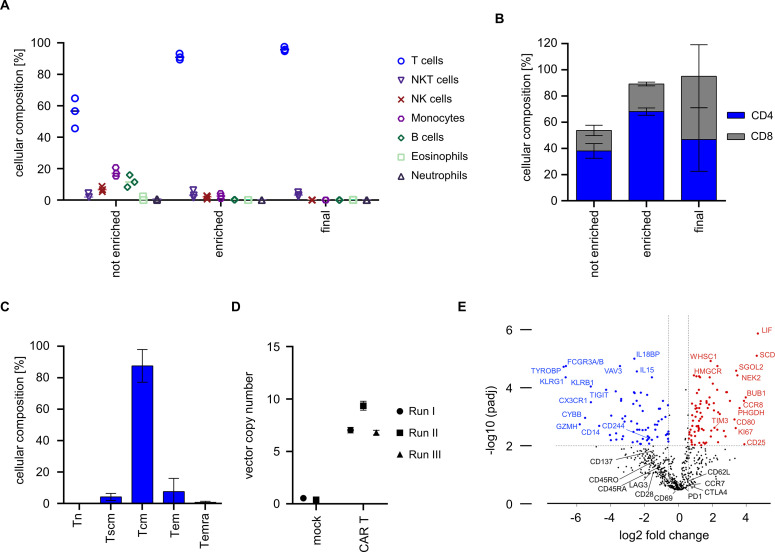
Figure 3.
Composition, phenotype and genotype of CAR T cells from automated manufacturing runs. (A) Cellular composition was analyzed before and after enrichment on day 0 as well as in the final cell product using flow cytometry. (B) CD4/CD8 ratio was analyzed before and after enrichment as well as after harvest. (C) T cell immunophenotype in final cell product. T cells were stained with antibodies against CD45RO, CD62L and CD95 and frequency of naïve T cells (Tn), stem-cell memory T cells (Tscm), central memory T cells (Tcm), effector memory T cells (Tem), and CD45-RA+ effector memory T cells (Temra) was assessed in the final cell product by flow cytometric analysis. (D) Vector copy numbers were analyzed from final cell products (CAR T, N=3) or mock T cells (control, N=2). (E) Gene expression profiles of cells from final cell product (N=4) were compared by Nanostring analysis to that of freshly isolated T cells (N=10). (B, C) Show mean±SD from N=3 donors.

