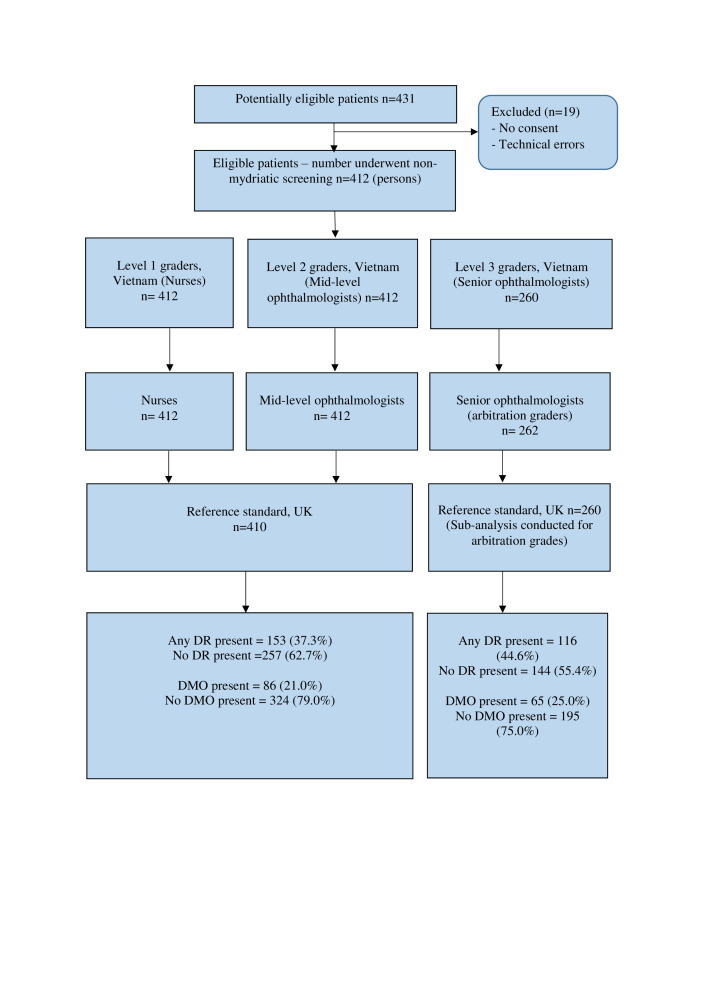
Figure 1.
Flow diagram to illustrate enrolment of patients and management of images in phase I from August to October 2018 (initial grading performance analysis). Level 1 and level 2 graders graded the same set of photographs and level 3 graders graded a subset of these photographs: all disagreements between level 1 and 2 graders and a 40% random sample of all images. DMO, diabetic macular oedema; DR, diabetic retinopathy.

