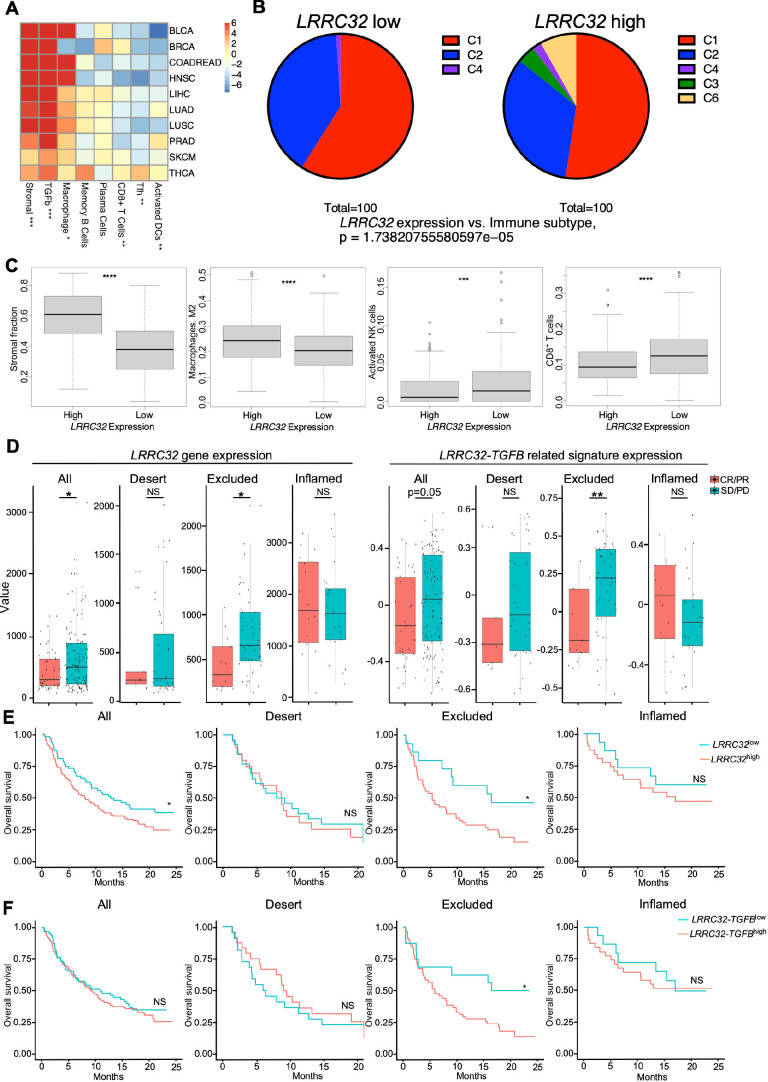
Figure 1.
Impact of LRRC32 gene expression on immune landscape in human cancers and ICB responsiveness. (A–C) TCGA analysis. (A) Correlation of LRRC32 expression level with indicated immune pathways in multiple human cancer types. Values in each cell indicates t-statistics comparing the top 1/3 vs the bottom 1/3 LRRC32 expression groups. Numbers in the heatmap indicated t-statistics result, and >2 or < −2 are statistically significant in a positively or negatively correlated manner, respectively. (B) Correlation of immune subtypes between LRRC32 expression and non-small cell lung cancer. (C1. Wound healing. C2. IFN-γ dominant. C3. Inflammatory. C4. Lymphocyte depleted. C6. TGF-β dominant) (C) Box plots comparing related immune pathway enrichment in human lung cancers between high and low LRRC32 gene expression groups. Statistical significance was determined using t-tests for A and C, and Fisher’s exact test for B. (D–F) Bulk RNA-seq data analysis of pre-treatment tumor samples from 167 patients with metastatic urothelial cancer (mUC) who received atezolizumab in phase two clinical trial (IMvigor210). (D) Box plots comparing the expression of LRRC32 gene (left) and LRRC32-TGFB related signatures (right, defined in online supplemental methods) in all types, immune-desert, excluded and inflamed tumors. Responders (CR/PR) in red and non-responders (SD/PD) in blue. (E, F) Kaplan-Meier survival plots comparing overall survival probability (y-axis) and follow-up time (months, x-axis) in all cancer types including immune-desert, excluded, inflamed tumors. Groups were split by high (red) and low (green) expression levels of LRRC32 gene (E) or LRRC32-TGFB related gene signatures (F). Significance was determined by using t-test for D, and log rank tests for E, F. *p<0.05; **p<0.01, ***p<0.001, ****p<0.0001. CR, complete response; PD, progressive disease; PR, partial response; SD, stable disease.

