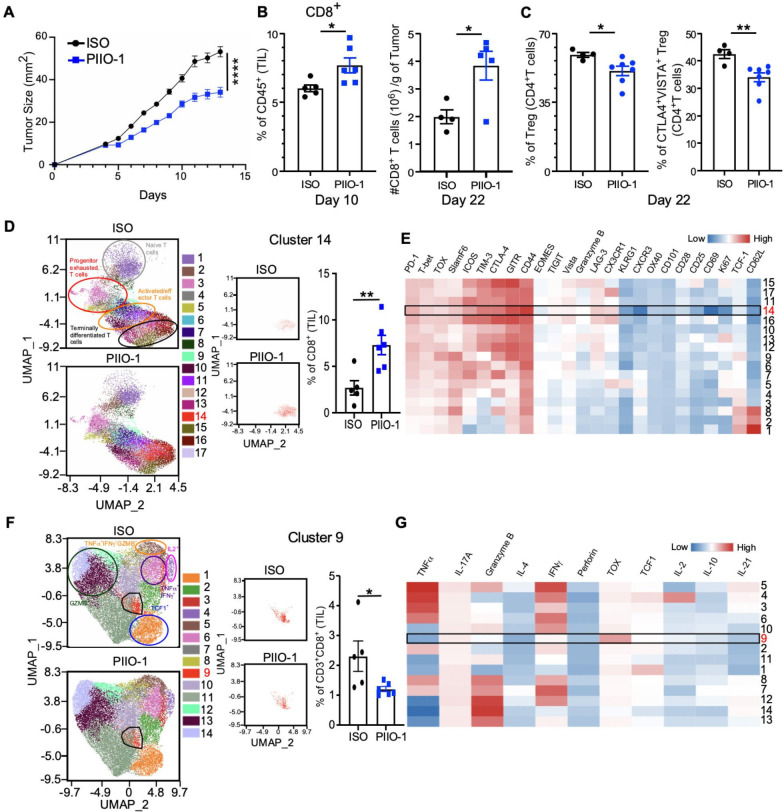
Figure 4.
PIIO-1 monotherapy modulates CD8+ T cells in the TME and confers protection against cancer in hLRRC32KI mice. (A) 1×105 MB-49 cells were injected s.c. on the right flank of hLRRC32KI male mice. PIIO-1 or isotype control (ISO) was administered (200 µg/mouse, i.p.) every 3 days for a total of four treatments starting on day 4. Shown is one representative tumor growth curve. (B) 1×105 MB-49 cells were injected s.c. on the right flank of hLRRC32KI male mice. PIIO-1 was delivered (200 µg/mouse, i.p.) on days 6 and 9. Tumors were collected on day 10 and tumor-infiltrating leucocytes were stained and analyzed by flow cytometry. Frequency of CD8+ T cells as a proportion of live CD45+ lymphocytes is shown (left). A similar experiment was performed wherein mice were treated with PIIO-1 for a total of 6 treatments starting on day 6. CD8+ TILs were quantified on day 22 (right). (C) Frequency of total Tregs (CD25+Foxp3+) (left) and CTLA4+VISTA+ Tregs (right) in tumor-infiltrating CD4+ T cells in the indicated treatment groups. (D) Differential expression analysis of cluster frequency of CD8+ TILs between ISO and PIIO-1 treated TILs. UMAP dimension reduction of tumor-infiltrating CD8+ T cells from B after staining with 33 markers and high dimensional spectral flow cytometry analysis. Data shown is gated on live CD45+CD3+CD8+ T cells, subsampled on 5000 cells per sample. Unsupervised clustering analysis was done using FlowSOM algorithm with an elbow method approach for cluster number determination. (E) Heatmap of D showing the relative expression levels of indicated markers by each cluster. (A–E) n=4–6 mice per group. (F) Differential expression analysis of cytokine production by CD8+ TILs between ISO and PIIO-1 treated tumors. 1×105 MB-49 cells were injected s.c. on the right flank of hLRRC32KI male mice. PIIO-1 or IOS was administered every 3 days for a total of 4 treatments starting on day 5. Tumors were collected on day 17. Intracellular stain for 17 cytokine panel was done, followed by spectral flow cytometry and analysis of CD45+CD3+CD8+ T cells. (G) Cytokine level in panel (F) indicated by heatmap showing expression intensity of cytokines by each CD8+ T cell cluster. Tumor curve analysis was performed using repeated measures two-way analysis of variance. Cluster differences were measured by two-tailed Student’s t test. Data are represented as mean±SEM. *P<0.05, **p<0.01, ****p<0.0001.

