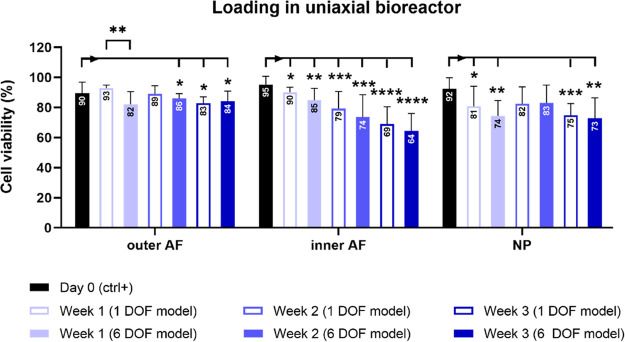
Figure 4.
Cell viability during 3 weeks of IVD culture under physiological conditions in the uniaxial bioreactor. The viability was assessed with lactate dehydrogenase and ethidium homodimer staining and quantified in 1 DOF and 6 DOF models in outer annulus fibrosus (AF), inner AF, and nucleus pulposus (NP) regions on IVD sections. Day 0 represents a nonloaded positive control group. Data are shown as the mean of four regions of interest from 2 (week 1, 2, and 3) or 3 (day 0) biological replicates + standard deviation. Statistical analysis was performed using a nonparametric and parametric t-test, where p < 0.05 (*), p < 0.01 (**), p < 0.001 (***), and p < 0.0001 (****) were statistically significant. Asterisks above a bar indicate a significant difference between day 0 and the loaded groups, and asterisks between the bars indicate a significant difference between the 1 DOF and 6 DOF models.

