Figure 2.
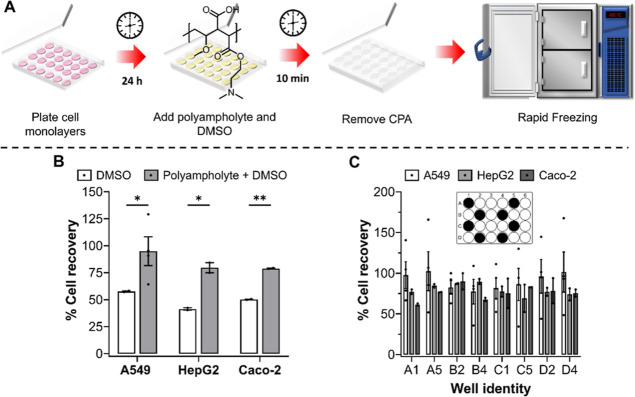
Post-thaw cell recovery of cell monolayers. (A) Schematic of the monolayer cryopreservation process. (B) Percentage cell recovery of A549 (n = 4), HepG2 (n = 2), and Caco-2 (n = 2) cell monolayers following cryopreservation with 10% v/v DMSO (white bar) or 10% v/v DMSO and 40 mg mL–1 polyampholyte (grey bar). (C) Percentage cell recovery of A549 (white bar), HepG2 (grey bar), and Caco-2 (dark grey bar) cell monolayers in selected individual wells (filled in black in the 24-well plate schematic) following cryopreservation in 10% v/v DMSO and 40 mg mL–1 polyampholyte. Data is presented by average percentage cell recovery ± SEM of n independent repeats (ANOVA, Tukey PostHoc; *p ≤ 0.05, **p ≤ 0.01).

