Figure 5.

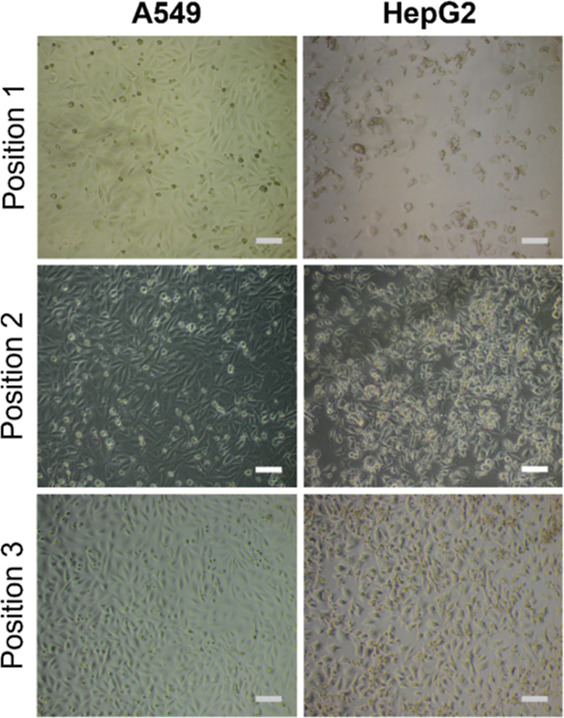
Phase contrast images of A549 and HepG2 monolayers, cryopreserved with 10% v/v DMSO and 40 mg mL–1 polyampholyte, were taken at 3 positions within an individual well. Scale bar = 100 μm.

Phase contrast images of A549 and HepG2 monolayers, cryopreserved with 10% v/v DMSO and 40 mg mL–1 polyampholyte, were taken at 3 positions within an individual well. Scale bar = 100 μm.