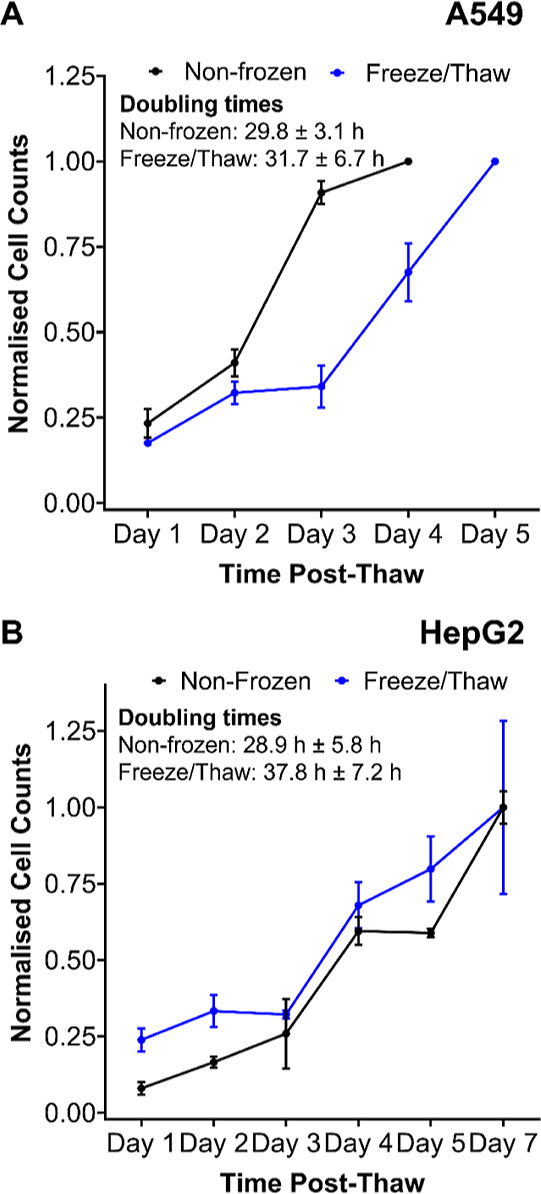
Figure 8.

Post-thaw growth curve measurements. Nonfrozen and post-thaw (A) A549 and (B) HepG2 cells were counted daily until fully confluent to determine proliferation rates. Cell counts were normalized relative to the final count and reported ± SEM of 2 independent repeats.
