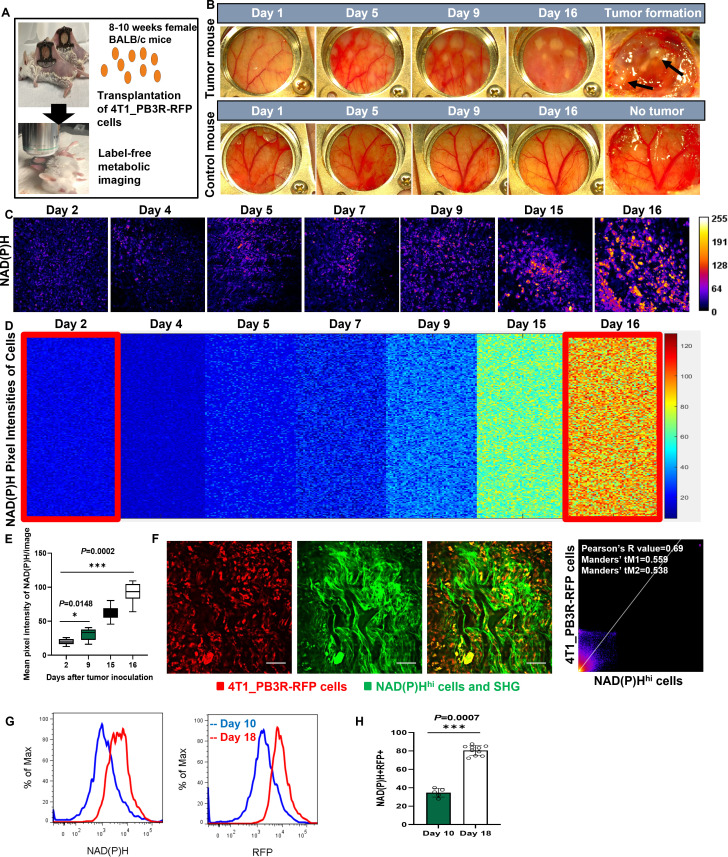
Figure 1.
Metabolic profiling by intravital NAD(P)H autofluorescence imaging reveals tumor growth in skinfold models of triple-negative breast cancer. (A) Experimental set-up. Skinfold murine cancer models by transplantation of 1×10⁶ 4T1_PB3R-RFP cells in BALB/c female mice were established and subjected to label-free metabolic intravital imaging (LMII). (B) Representative time-lapse anatomical imaging of tumor growth. Color anatomy shows formation of tumor nodules and angiogenesis in a skinfold window chamber of a tumor model over a control mouse. Tumor formation was clearly confirmed after removing the skinfold chamber (arrows). (C) In vivo LMII shows a complete overview of tumor growth with increasing trend of NAD(P)H signal. (D) Kinetics of single-cell metabolism with NAD(P)H signal. Each colored small square represents the visible pixel intensity of NAD(P)H in each cancer cell. The 10,000-pixel intensities were randomly measured from the cells in different mice every day for 16 days (n=7 mice). Cellular NAD(P)H signals on day 2 and day 16 show significant difference as highlighted by big red rectangles. (E) Quantification of NAD(P)H signal changes with tumor growth (n=9 images, p=0.0002 for mean pixel intensity of NAD(P)H on day 2 and day 16). (F) Representative LMII data show high overlap between 4T1_PB3R-RFP cells and NAD(P)H expressing cells. Fibrillar structures indicate collagen visualized by second harmonic generation (SHG). Scales, 20 µm. The rightmost graph represents a scatter plot of the intensities registered in NAD(P)H and RFP channels. Pearson’s R coefficient for correlation measurement and Manders’ coefficients for co-occurrence measurement are indicated in the top left corner of the plot. (G, H) Flow cytometry data and a bar graph show that NAD(P)H+ cells, RFP+ cells, and NAD(P)H+RFP+ cells are significantly increased from day 10 to day 18 (n=15 mice, p=0.0007 for the number of NAD(P)H+RFP+ cells on day 10 and day 18). NAD(P)H, reduced nicotinamide adenine dinucleotide (phosphate) hydrogen; NAD(P)Hhi, cells high in NAD(P)H intensity; RFP, red fluorescent protein.

