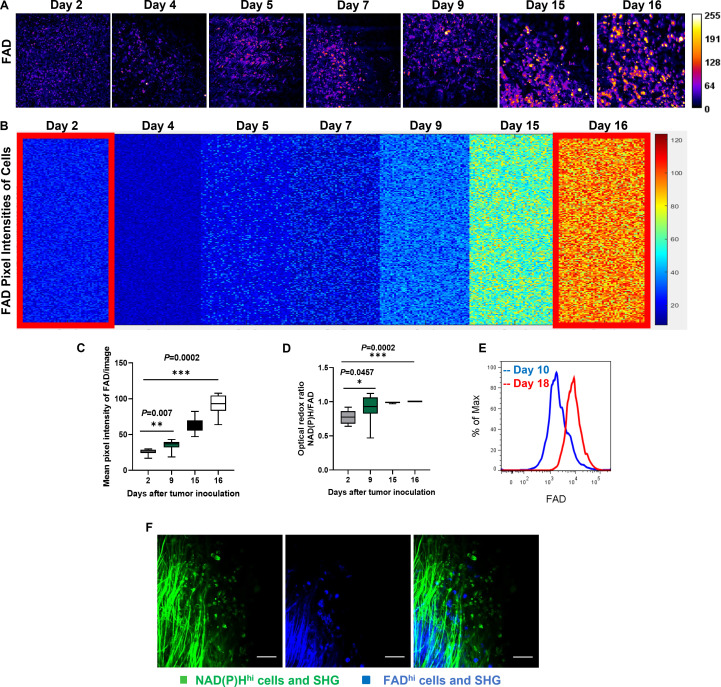
Figure 2.
Metabolic profiling by intravital FAD autofluorescence imaging reveals tumor growth in skinfold models of triple-negative breast cancer. (A) Label-free metabolic intravital imaging (LMII) shows increasing trend of FAD signal with tumor growth. (B) Kinetics of single-cell metabolism with FAD signal. Each colored small square represents the visible pixel intensity of FAD in each cancer cell. The 10,000-pixel intensities were randomly measured from the cells in different mice every day for 16 days (n=7 mice). Cellular FAD signals on day 2 and day 16 show significant difference as highlighted by big red rectangles. (C) Quantification of FAD signal changes with tumor growth (n=8 images, p=0.0002 for mean pixel intensity of NAD(P)H on day 2 and day 16). (D) Increased redox ratio was observed with tumor growth from day 2 to day 16 (p=0.0002 for optical redox ratio on day 2 and day 16). (E) Flow cytometry data show increased population of FAD+ cells with tumor growth from day 10 to day 18. (F) In vivo LMII of NAD(P)H and FAD in tumor environment provides endogenous stromal and tumor cell contrast. Fibrillar structures indicate collagen visualized by second harmonic generation (SHG). Scales, 20 µm. FAD, flavin adenine dinucleotide; FADhi, cells high in FAD intensity; NAD(P)H, reduced nicotinamide adenine dinucleotide (phosphate) hydrogen; NAD(P)Hhi, cells high in NAD(P)H intensity.

