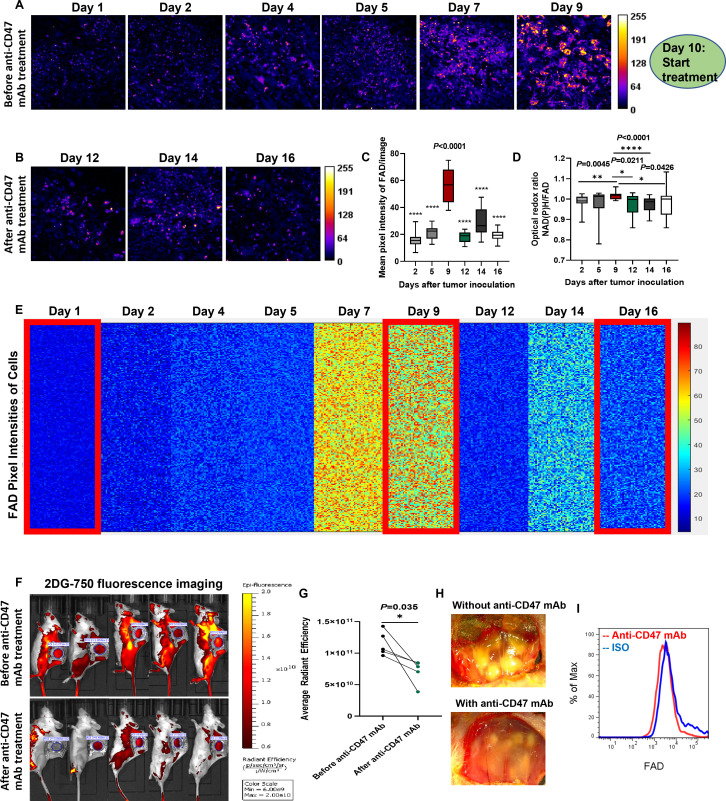
Figure 5.
Sensitive monitoring of anti-CD47 therapy response by dynamic metabolic imaging of FAD. (A, B) Label-free metabolic intravital imaging (LMII) of FAD demonstrates similar sensitive early response with NAD(P)H imaging after anti-CD47 mAb (MIAP301) treatment of a triple-negative breast cancer model (10 mg/kg intravenous injection daily for 5 days). (C) Quantification of average intensity shows statistically significant difference in FAD signals before and after MIAP301 treatment (n=16 images, p<0.0001). (D) Optical redox ratio was increased with tumor growth and decreased with anti-CD47 mAb treatment. (E) Kinetics of single-cell metabolism with FAD signal. Each colored small square represents the visible pixel intensity of FAD in each cancer cell. The 10,000-pixel intensities were randomly measured from the cells in different mice every day for 16 days (n=6 mice). Metabolic signal of FAD has been increased with tumor growth from day 1 to day 9 and dramatically decreased with start of anti-CD47 mAb treatment from day 10. (F, G) Conventional whole-body fluorescent glucose imaging with 2-DG 750 verified cancer treatment with significant decrease of glucose uptake after anti-CD47 mAb treatment (n=5 mice). LMII shows superior sensitivity to detect immunotherapy response (p<0.0001 in C) over fluorescent glucose imaging (p=0.035 in G). (H) Visual inspection of treatment effect by color anatomy images. (I) The signal from FAD+ cells was significantly decreased after MIAP301 treatment when compared with isotype control as determined by flow cytometry. 2-DG, 2-DeoxyGlucosone; CD47, cluster of differentiation 47; FAD, flavin adenine dinucleotide; mAb, monoclonal antibody; NAD(P)H, reduced nicotinamide adenine dinucleotide (phosphate) hydrogen.

