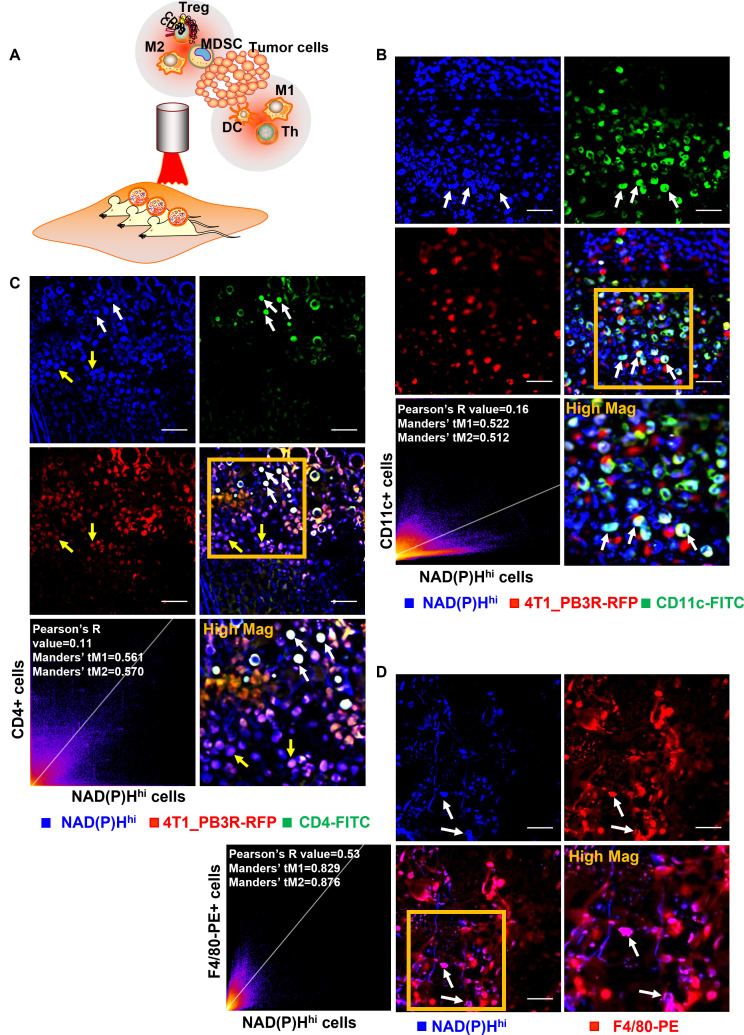
Figure 6.
Intravital imaging reveals co-localization of NAD(P)Hhi and immune-active cells in tumor microenvironment. (A) Diagram depicting intravital imaging set-up for visualization of immune-active and immunosuppressive cells in a tumor mouse skinfold chamber. (B) Representative intravital images of NAD(P)Hhi cells (blue), 4T1_PB3R-RFP+ cells (red), and CD11c-FITC+ cells (green). Arrows indicate in vivo co-localization of NAD(P)Hhi cells and CD11c-FITC+ cells. (C) Representative intravital images of NAD(P)Hhi cells (blue), 4T1_PB3R-RFP+ cells (red), and CD4-FITC+ cells (green). White arrows indicate in vivo co-localization of NAD(P)Hhi cells and CD4-FITC+ cells and yellow arrows indicate NAD(P)Hhi RFP+ cells. (D) Representative intravital images of NAD(P)Hhi cells (blue) and F4/80-PE+ cells (red). Arrows indicate in vivo co-localization of NAD(P)Hhi cells and F4/80-PE+ cells. Scales, 20 µm. Quantitative co-localization analysis using Pearson’s coefficient and Manders’ coefficients revealed that a small portion of NAD(P)Hhi cells are targeting various types of immune-active cells including CD11c+ dendritic cells (DCs), CD4+ helper T (Th) cells, and F4/80+ macrophages in triple-negative breast cancer models (scatter plots in B–D). CD4, cluster of differentiation 4; FITC, fluorescein isothiocyanate; NAD(P)H, reduced nicotinamide adenine dinucleotide (phosphate) hydrogen; NAD(P)Hhi, cells high in NAD(P)H intensity; PE, phycoerythrin; RFP, red fluorescent protein; Treg, regulatory T cells; MDSC, myeloid-derived suppressor cells.

