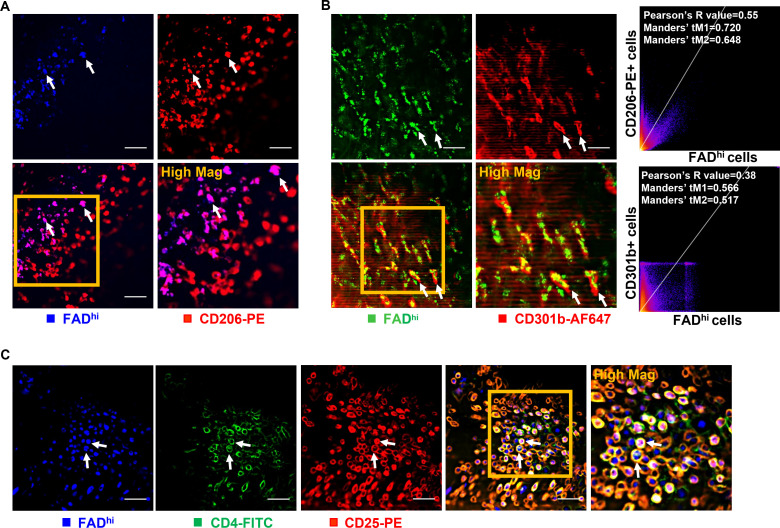
Figure 7.
Intravital imaging reveals co-localization of FADhi and immunosuppressive cells in tumor microenvironment. (A) Representative intravital images of FADhi cells (blue) and CD206-PE+ cells (red). (B) Representative intravital images of FADhi cells (green) and CD301b-AF647+ cells (red). Scatter plots depicted quantitative co-localization analysis using Pearson’s coefficient and Manders’ coefficients. (C) Representative intravital images of FADhi cells (blue), CD4-FITC+ cells (green), and CD25-PE+ cells (red). Scales, 20 µm. In vivo co-localization analysis shows specific targeting ability of metabolic FAD imaging for various types of immunosuppressive cells including CD206+ or CD301b+ M2 macrophages and CD4+ CD25+ regulatory T cells in triple-negative breast cancer models. AF, Alexa Flour; CD, cluster of differentiation; FAD, flavin adenine dinucleotide; FADhi, cells high in FAD intensity; FITC, fluorescein isothiocyanate; PE, phycoerythrin.

