
Figure 16.
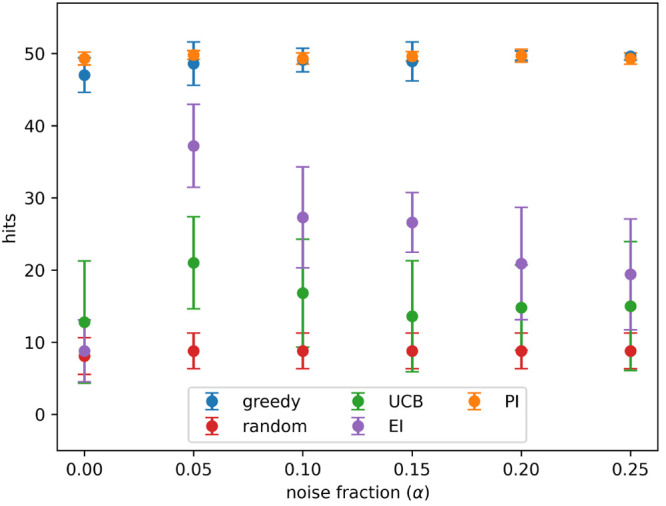
Hits in the top 1% found after 8 active learning batches for each acquisition metric on the simulated data set with different levels of noise. Noise added using eq 3 and the indicated values for α. Results show the mean of 10 runs, and the error bars indicate the standard deviation. Acquisition metrics: greedy, random, UCB - upper confidence bound, EI - expected improvement, PI - predicted improvement.