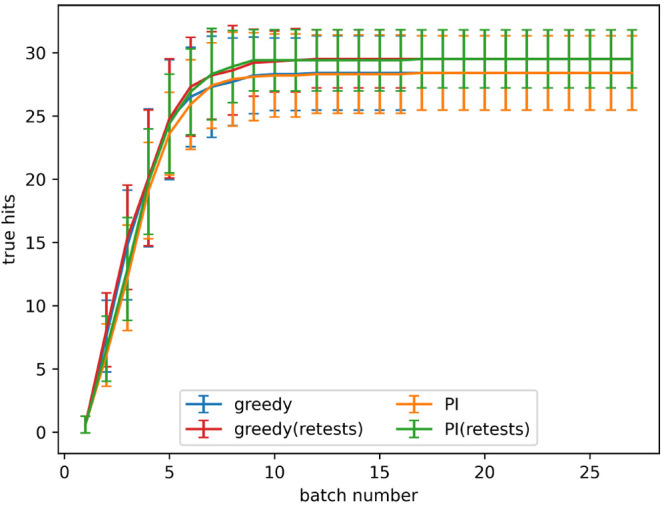
Figure 17.

True hits in the top 1% found using active learning, both with and without retests, on the simulated data set for the predicted improvement (PI) and greedy acquisition metrics. Noise added using α = 0.2 in eq 3. The graph shows the mean of 10 runs, and the error bars indicate the standard deviation.
