
Figure 5.
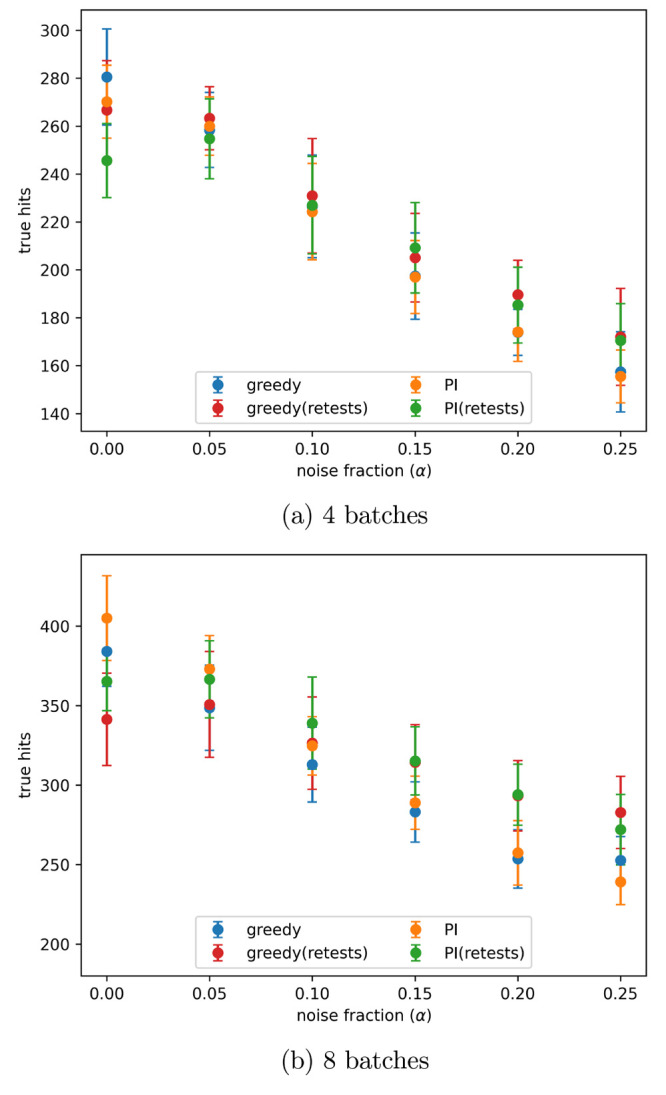
Number of true hits found after the indicated number of active learning batches, with different levels of artificial noise in the data, both with and without retests. Noise added using the indicated α values in eq 3. Results are the mean of 10 runs with the error bars showing the standard deviation. The acquisition metrics used were greedy and predicted improvement (PI).