
Figure 8.
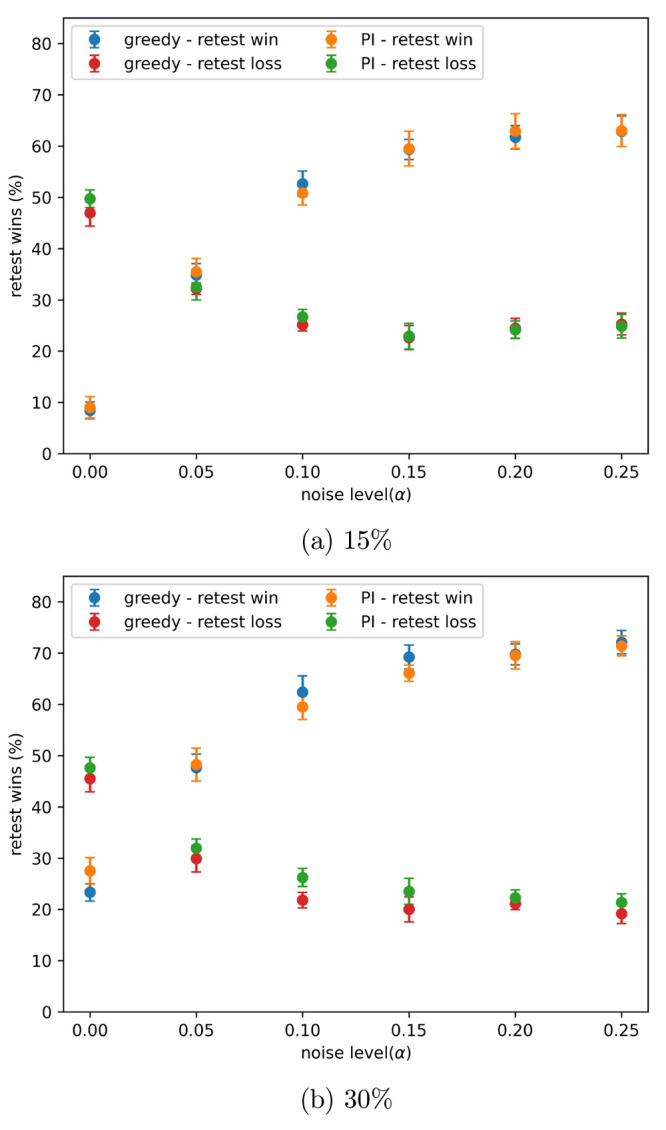
Percentage of data sets using retests finds more true hits than not using retests, with different amounts of noise present, after approximately the indicated percentage of the data set has been added in batched Bayesian optimization. Noise added using the indicated α values in eq 3. Drawn data sets are not shown. Results show the mean of 10 runs, and the error bars indicate the standard deviation.