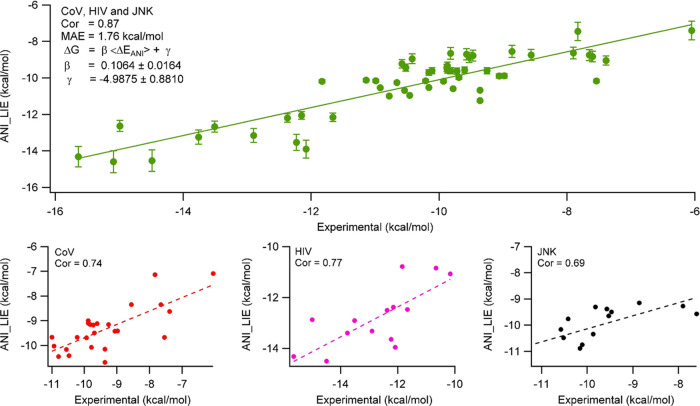
Figure 3.
ANI interaction energies calculated from eq 4 with β = 0.10639 ± 0.0164 and γ = −4.9875 ± 0.881 using average of 100 snapshots of 10 ns MD simulations for 54 protein–ligand complexes, showing 0.87 correlation to the experimental values. The bar lines show uncertainties. The bottom plots show the fits of individual protein families as CoV, HIV-1, and JNK-1.

