
Figure 2. Associations between IGF-1 or IGFBP-3 with MRI outcomes by CRP subgroups.
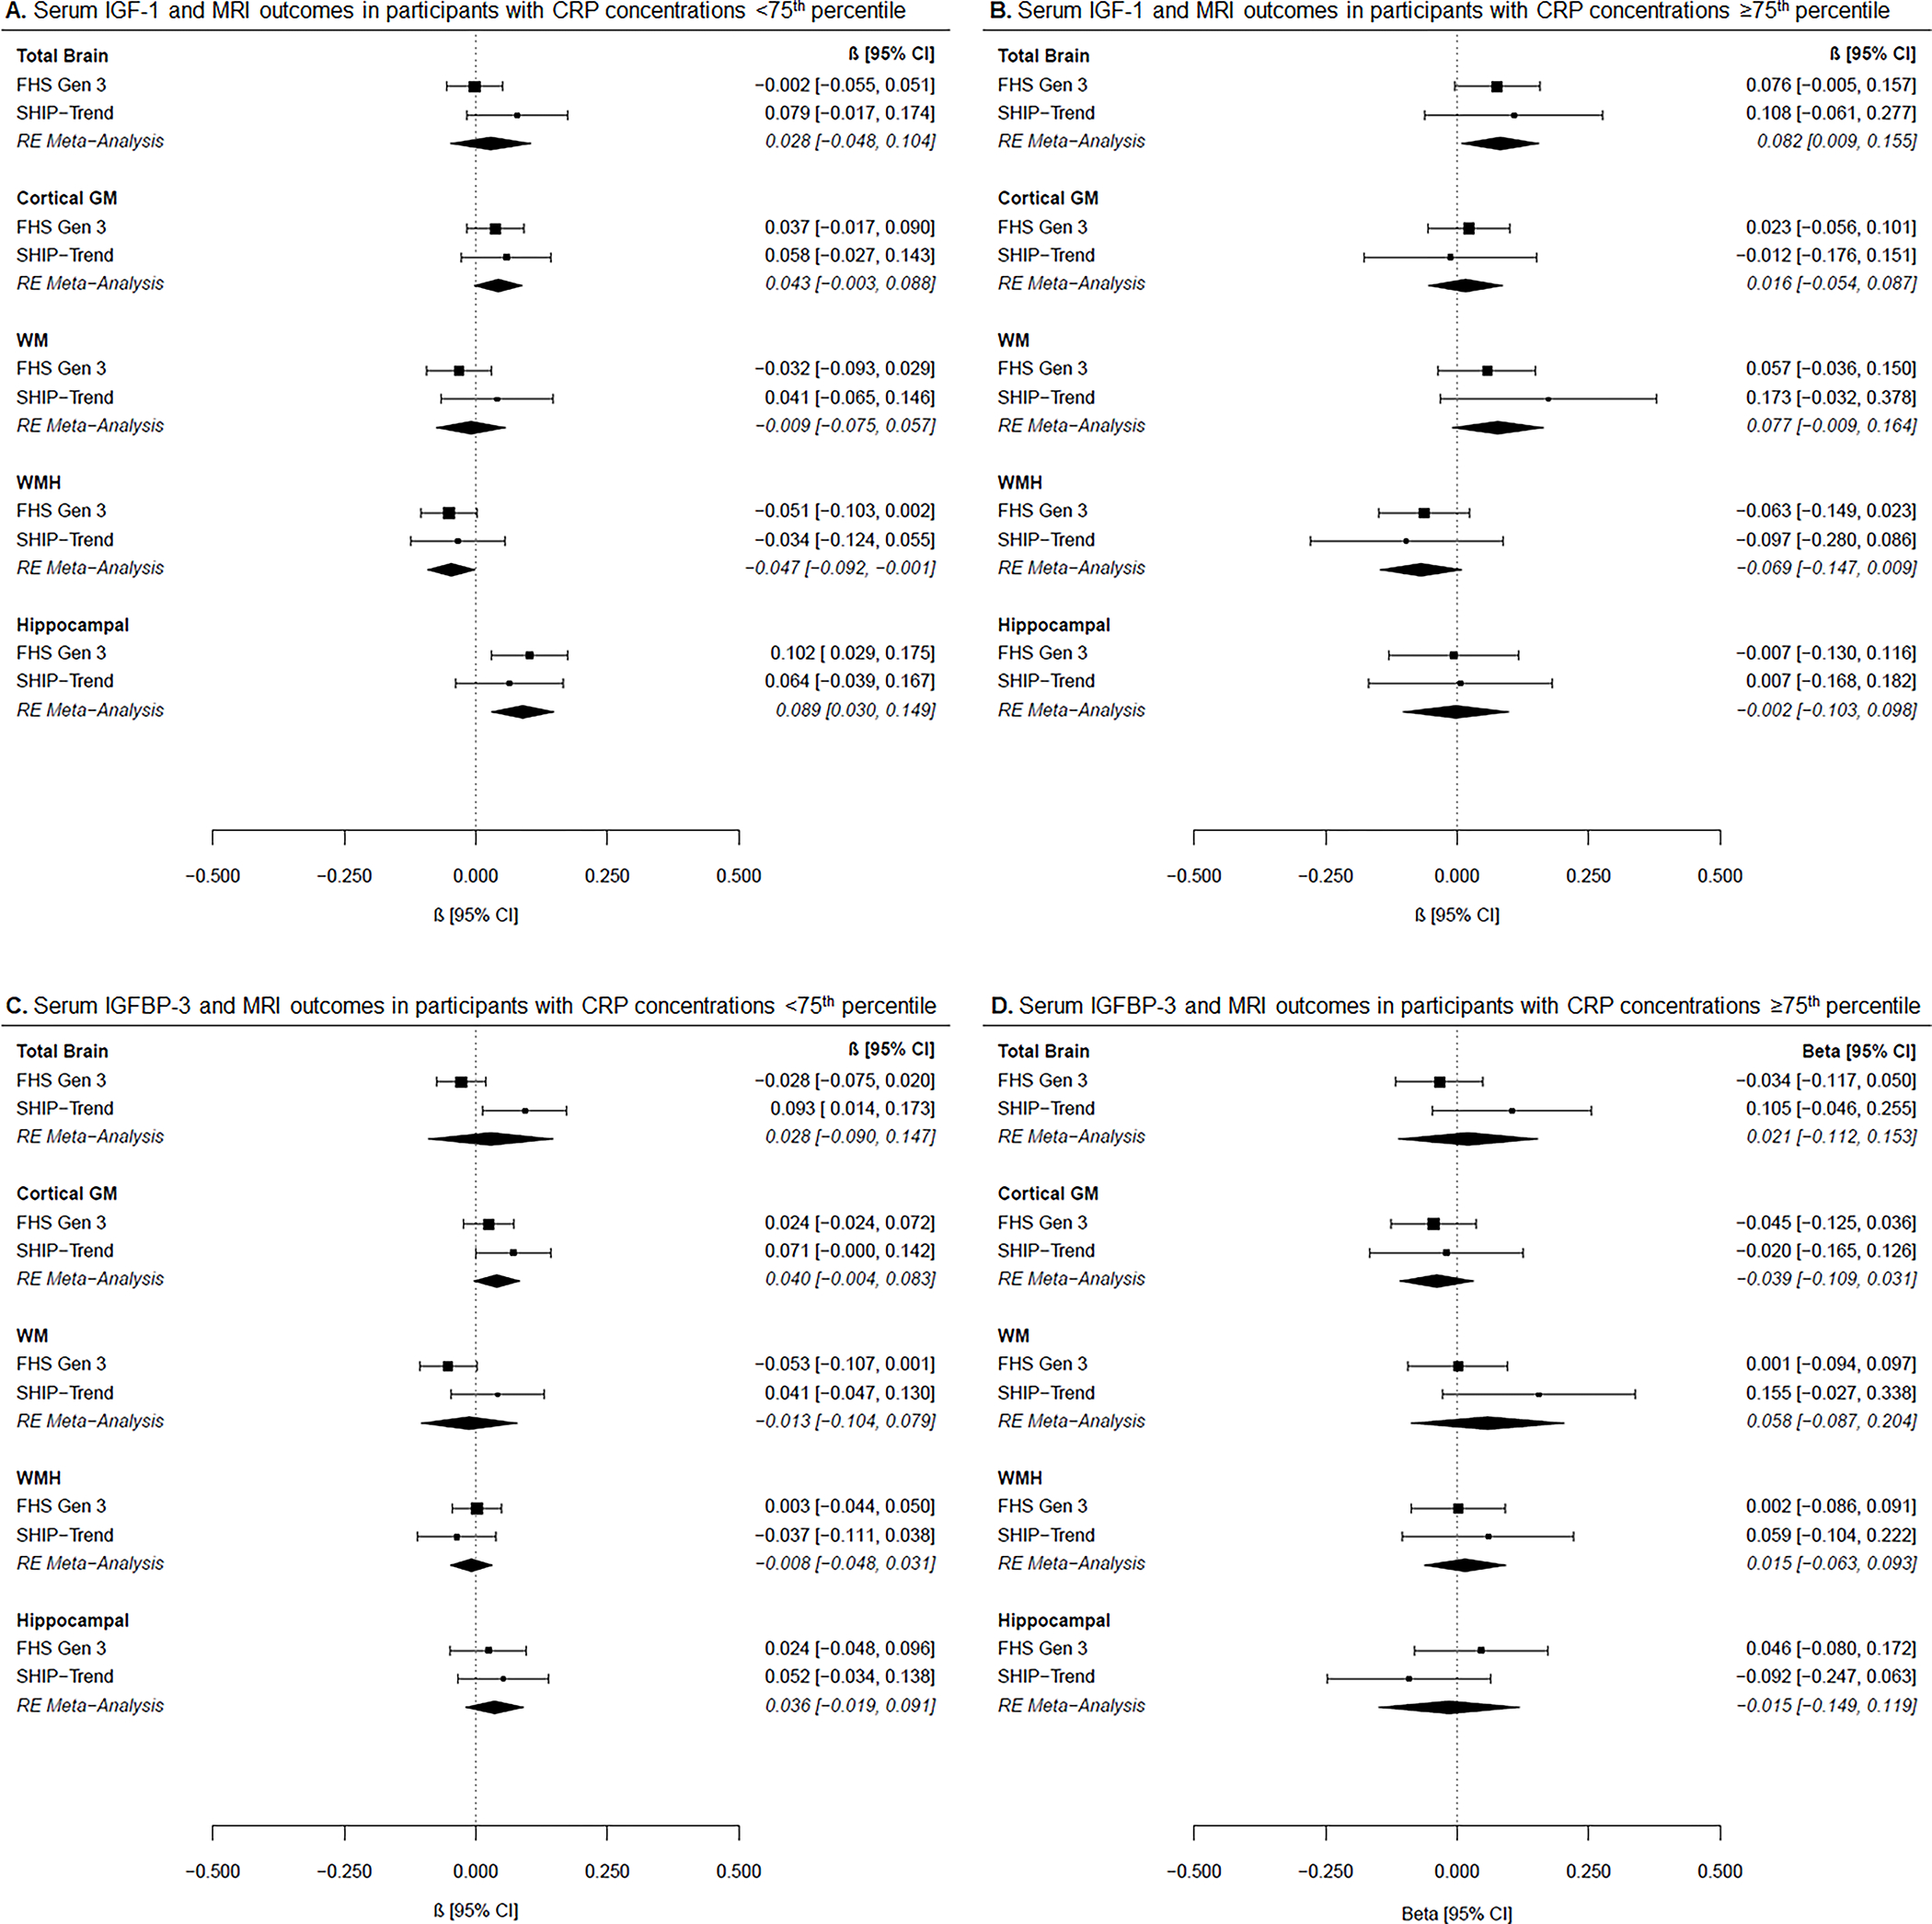
Forest plots of cohort-specific and meta-analysis results for the associations between (A) IGF-1 and MRI measures in participants with CRP concentrations <75th percentile, (B) IGF-1 and MRI measures in participants with CRP concentrations ≥75th percentile, (C) IGFBP-3 and MRI measures in participants with CRP concentrations <75th percentile, and (D) IGFBP-3 and MRI measures in participants with CRP concentrations ≥75th percentile. Beta estimates and 95% confidence intervals (CI) are presented graphically in the center, where the square represents beta coefficients and the error bars the 95% confidence intervals per cohort according to the text on the right column. Meta-analysis results derived from random-effects (RE) models are presented with diamonds and italicized text. Models are adjusted for age, age-squared, sex, time between blood draw and MRI, waist-to-hip ratio, systolic blood pressure, hypertension treatment, diabetes mellitus, current smoking, and prevalent cardiovascular disease. *p<0.05 after FDR correction.
Meta-analysis results are derived from random-effects models and presented in italic. </P>Abbreviations: FHS Gen 3: Framingham Heart Study Generation 3, SHIP-TREND: Study of Health in Pomerania TREND, IGF-1: insulin-like growth factor 1, IGFBP-3: insulin-like growth factor binding protein-3, GM: gray matter, WM: white matter, WMH: white matter hyperintensity, CRP: C-reactive protein