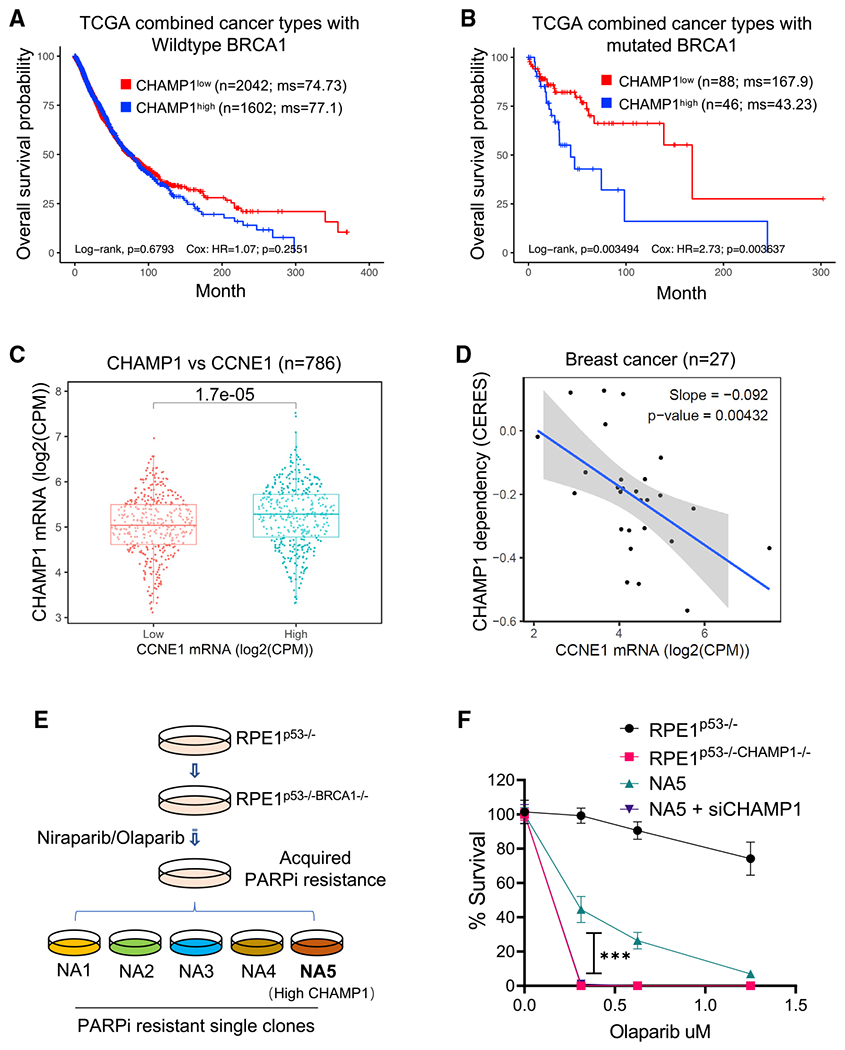
Figure 6. CHAMP1 overexpression is common in tumors with underlying HR deficiency and correlates with poor cancer patient prognosis.

(A and B) Kaplan-Meier curves depicting overall survival of patients from TCGA with CHAMP1 expression and wild-type BRCA1 (A), and mutated BRCA1 (B). This analysis combines tumors from these TCGA studies: BLCA (bladder), BRCA (breast), COAD/READ (colorectal), LUAD (lung), LUSC (lung squamous), OV (ovarian), and SKCM (skin). N represents number of patients.
(C) CHAMP1 expression positively correlates with cyclin E expression. N represents number of cancer cell lines.
(D) Breast cancer cells with high expression of CCNE1 are more dependent on CHAMP1 for survival. N represents number of cancer cell lines.
(E) Schematic of PARPi-resistant RPE1p53−/−BRCA1−/− cells generation. RPE1p53−/−BRCA1−/− cells were treated with increasing concentrations of the PARPis niraparib/olaparib over 3 months, and then isolated by single-cell clones from the niraparib- and olaparib-resistant pools.
(F) A 14-day clonogenic survival of RPE1p53−/−, RPE1p53−/−BRCA1−/−, and niraparib/olaparib-resistant RPE1p53−/−BRCA1−/− NA5 cell clone treated with various doses of olaparib after siControl or siCHAMP1 treatment. Error bars indicate SD, n = 3 independent experiments. ***p < 0.001. Statistical analysis was performed using two-way ANOVA.
