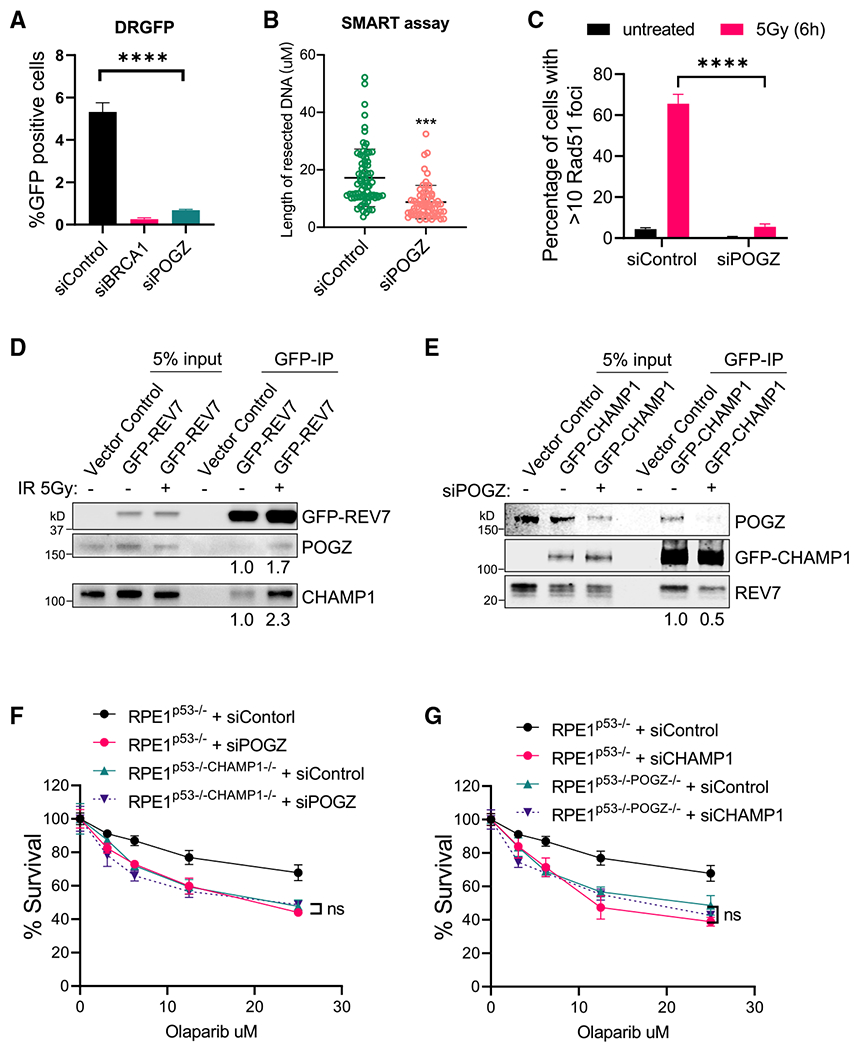
Figure 7. POGZ is epistatic with CHAMP1 in the regulation of homologous recombination.

(A) Graph showing the percentage of GFP-positive cells after DR-GFP analysis. U2OS cells were infected with I-SceI adenovirus and knocked down for BRCA1 or POGZ using siRNA. N = 3 biologically independent experiments. Error bars indicate SD, and p values were calculated using two-tailed Student’s t test, ****p < 0.0001.
(B) Quantification of resected ssDNA measured by SMART assay in U2OS cells treated by siControl or siRNAs targeting CHAMP1 for 48 h. Approximately 50 fibers were counted per experiment. Error bars indicate SD, and p values were calculated using Student’s t test, ***p < 0.001.
(C) Quantification of >10 RAD51 foci in wild-type and two CHAMP1 knockout U2OS cell lines 6 h after 5Gy IR treatment. Error bars indicate SD, n = 3 biologically independent experiments. ****p < 0.0001. Statistical analysis was performed using two-tailed Student’s t test.
(D) Western blot showing GFP-immunoprecipitation of GFP-REV7 in HEK293T cells treated with or without irradiation (5Gy), and the co-immunoprecipitation of endogenous CHAMP1 and POGZ.
(E) Western blot showing GFP-immunoprecipitation of GFP-CHAMP1 in HEK293T cells treated with or without siPOGZ, and the co-immunoprecipitation of endogenous CHAMP1 and POGZ.
(F) 3-day cytotoxicity analysis of RPE1p53−/− and RPE1p53−/−CHAMP1−/− cells treated with various doses of olaparib after 48 h siControl or siPOGZ treatment. Cell viability was detected by CellTiter-Glo (Promega). Error bars indicate SD, n = 3 independent experiments. Statistical analysis was performed using two-way ANOVA.
(G) 3-day cytotoxicity analysis of RPE1p53−/− and RPE1p53−/−POGZ−/− cells treated with various doses of olaparib after 48 h siControl or siCHAMP1 treatment. Cell viability was detected by CellTiter-Glo (Promega). Error bars indicate SD, n = 3 independent experiments. Statistical analysis was performed using two-way ANOVA. All of the immunoblots are representative of at least two independent experiments.
