
Figure 2. Intercellular Transfer of HPs in HeLa Cells.
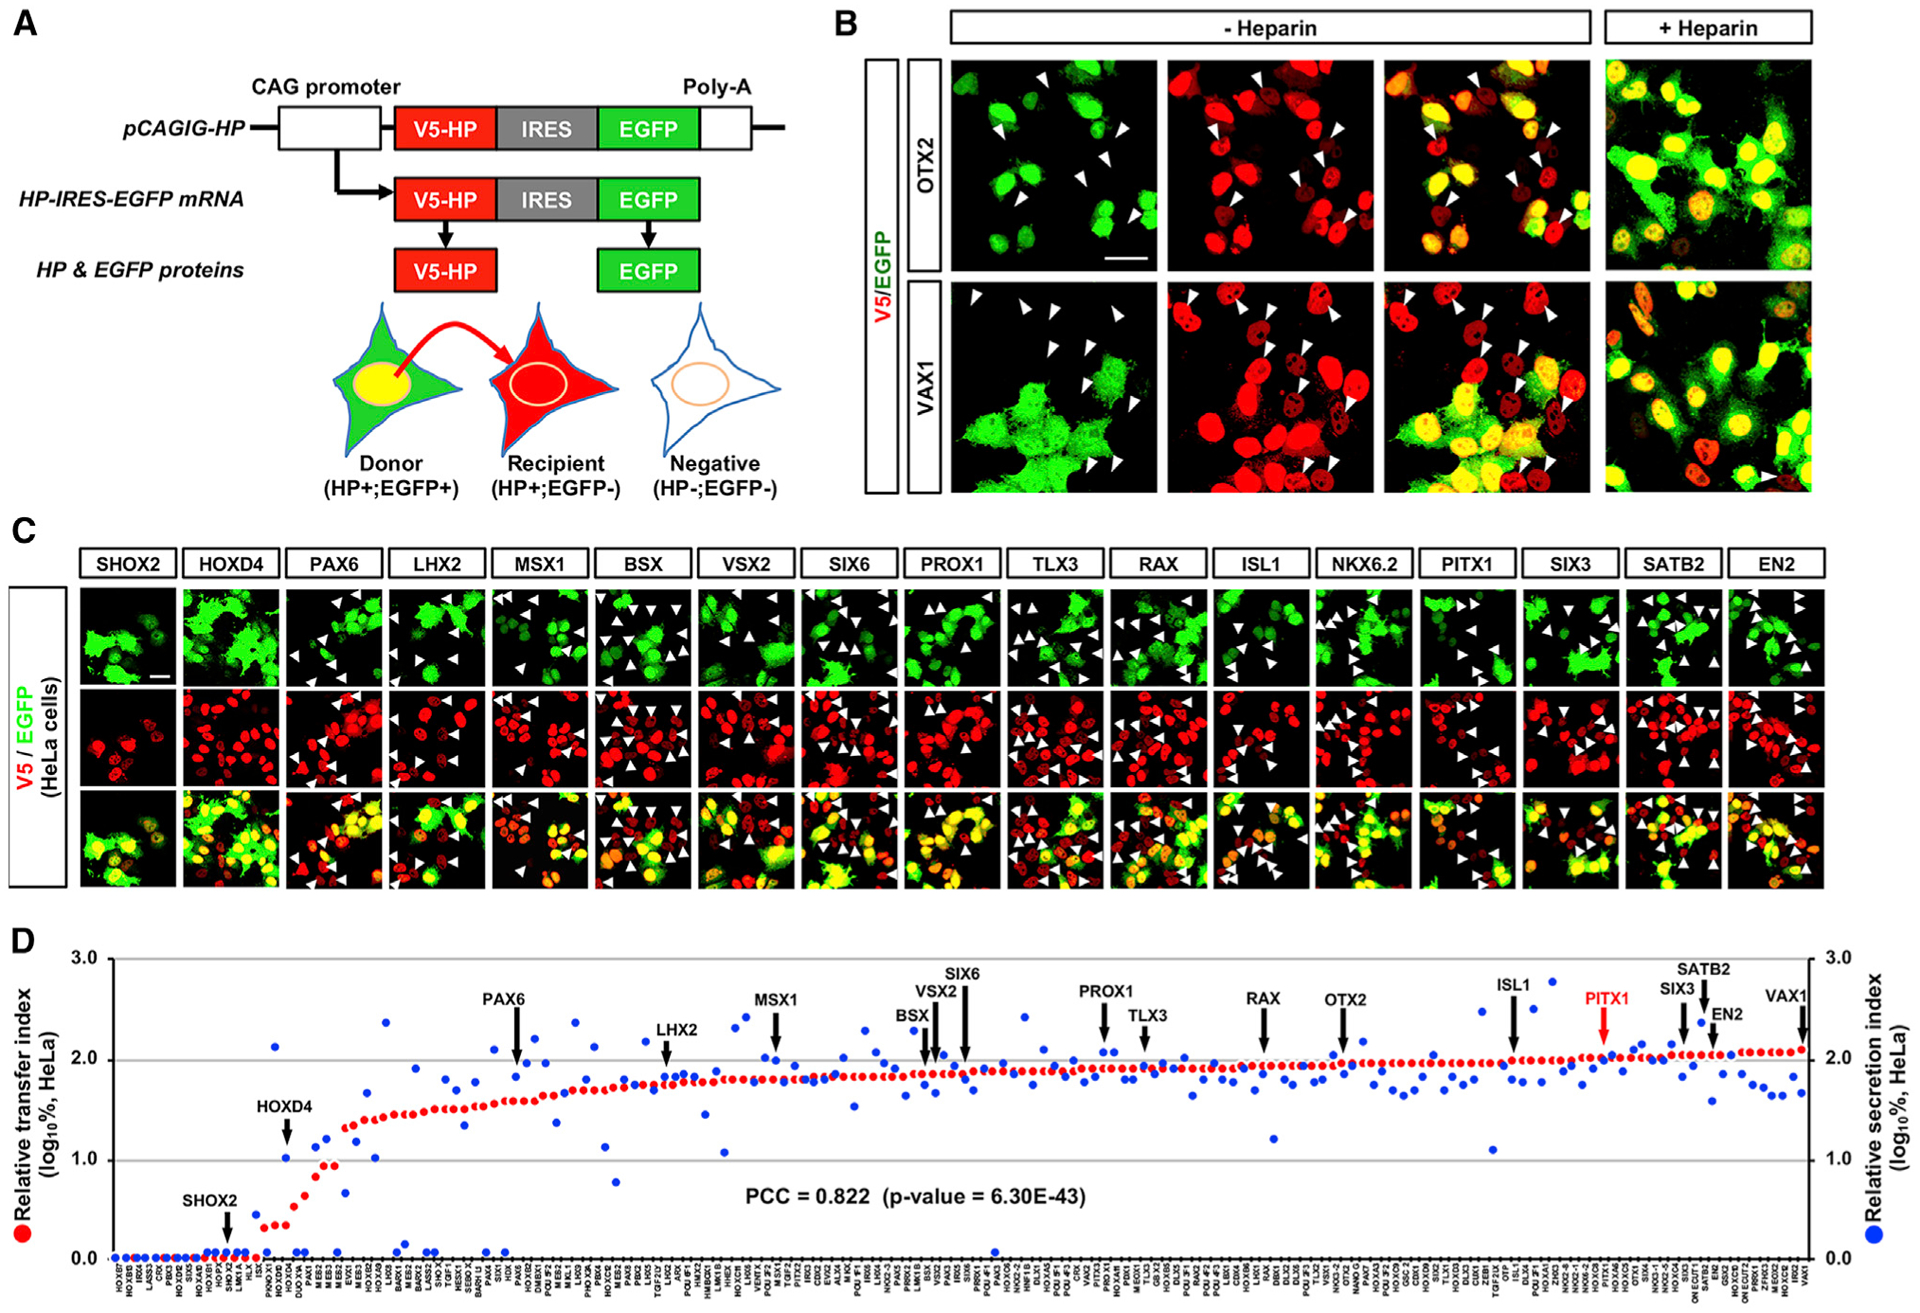
(A) Schematic diagram depicts the method determining intercellular transfer of HP. In principle, V5-HP (red) and EGFP (green) should be expressed in same cells (HP+;EGFP+; named as “donor”), because they are encoded in a same pCAGIG-HP DNA construct, transcribed in a single mRNA, and translated independently. Therefore, cells that express V5-HP alone can be determined as that they received it from the donor cells.
(B) HeLa cells, which were transfected with pCAGIG-V5-OTX2 (top) and pCAGIG-V5-VAX1 (bottom) plasmid DNA, respectively, were co-immunostained with mouse anti-V5 and chick anti-GFP antibodies. Arrowheads indicate the cells expressing V5-OTX2 and V5-VAX1 without EGFP. To test the effects of heparin on the transfer, we also added heparin (10 mg/mL) in the growth media. This interferes with the transfer of OTX2 and VAX1 (rightmost column).
(C) Representing immunostaining images of HeLa cells expressing V5-HPs. Arrowheads indicate cells containing V5-HPs (red) without EGFP (green).
(D) Relative secretion index (RSI) (y axis in right) and relative transfer index (RTI) (y axis in left) of each HP are displayed in blue and red dots, respectively. Values in the y axes are averages (n = 3). Correlation between RTI and RSI was determined by obtaining Pierson correlation coefficient (PCC), which is shown in the graph.
Scale bars, 25 μm.