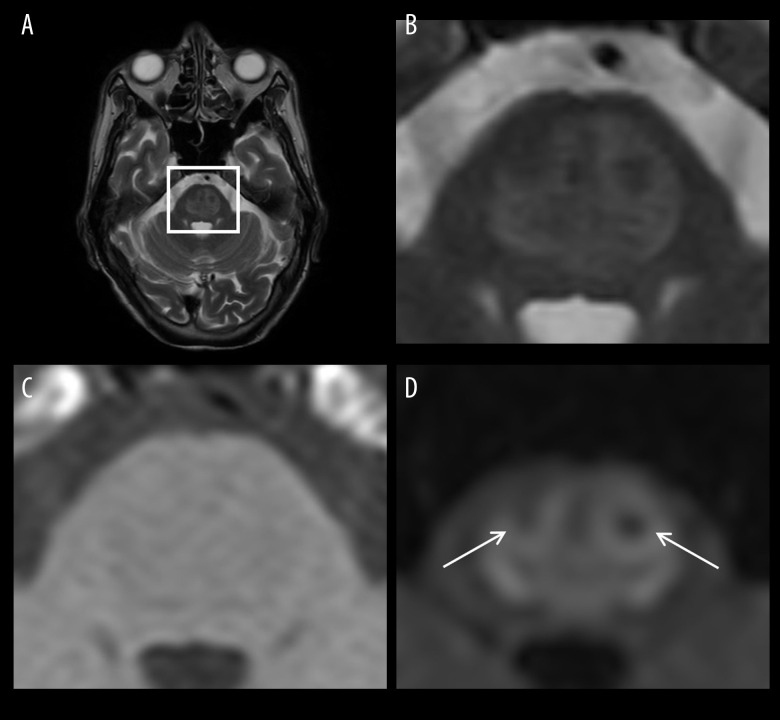
Figure 1.
Axial MRI scans taken on the day of disease onset. (A) T2-weighted (T2W) image at the level of the pons. (B) Enlarged T2W image of the square region indicated in (A) showing the central pontine lesion as a slightly high-signal area. (C) Enlarged T1-weighted (T1W) image of the square region indicated in (A) showing the central pontine lesion as a slightly low-signal area. (D) Enlarged diffusion-weighted (DW) image of the square region indicated in (A) showing the central pontine lesion as an apparently high-signal area resembling a piglet sign. Arrows indicate relatively spared descending corticospinal and corticobulbar tracts (the nostrils of the pig snout) within the lesion.

