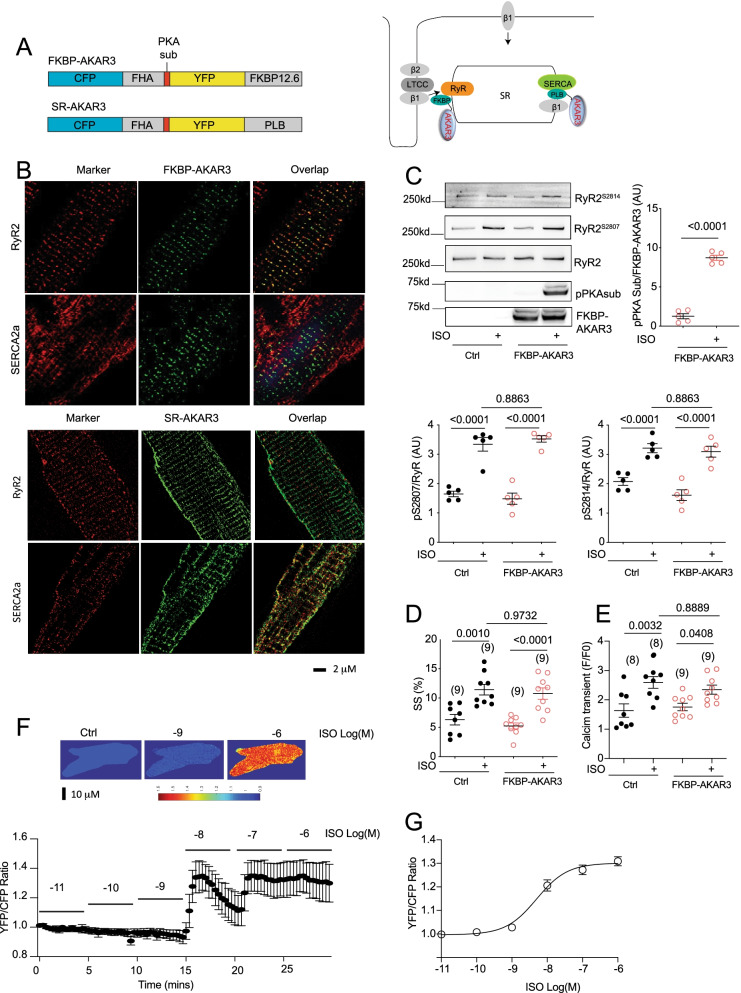
Fig. 1.
Development of biosensors to detect local PKA activity in AVMs. A Schematics of genetically encoded FRET-based FKBP-AKAR3 and SR-AKAR3 biosensors and the subcellular distribution in AVMs. B Confocal images show FKBP-AKAR3 and SR-AKAR3 colocalize with RyR2 and SERCA2a, respectively, in rabbit AVMs. C Western blot shows PKA phosphorylation of FKBP-AKAR3 and endogenous RyR2 expressed in rabbit AVMs after stimulation with 100 nmol/L of ISO. The phosphorylation of RyR2 at serine 2807 and 2814 and FKBP-AKAR3 at the PKA substrate site were detected with specific antibodies and quantified in dot plots (N = 5). D and E AVMs with and without expressing FKBP-AKAR3 were stimulated with 100 nmol/L of ISO, sarcomere shortening (SS) and calcium transient of rabbit AVMs were measured before and after ISO stimulation. The maximal increases in SS and calcium transient are summarized in dot plots. Data represent mean ± SEM of indicated number of AVMs from rabbits. F Images show the YFP/CFP ratio in rabbit AVMs before and after stimulation with different concentrations of ISO, the representative curve shows the time course of YFP/CFP ratio after stimulation. G A dose response curve of the maximal increases in YFP/CFP ratio after stimulation with different concentrations of ISO. Data represent mean ± SEM of AVMs from mice (EC50, 5.0 * 10–9 mol/L). p values were obtained by Student t-test between two groups or by one-way ANOVA analysis followed with Tukey’s multiple comparison test. AU, arbitrary unit

