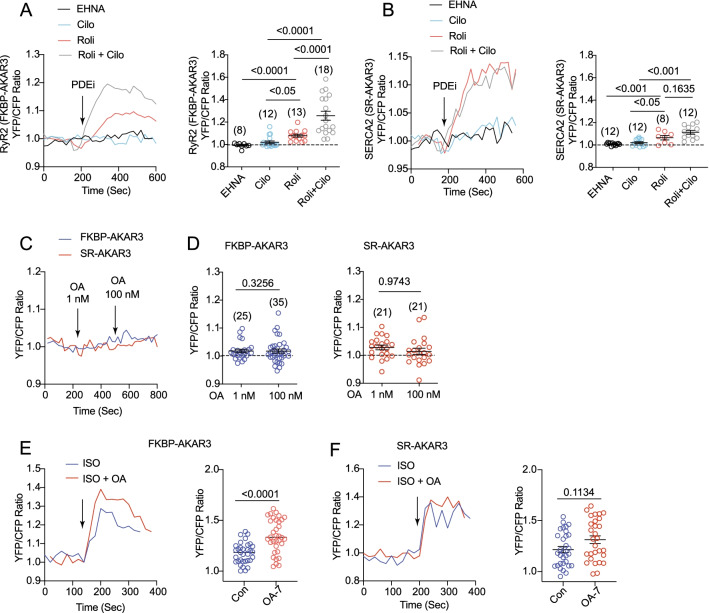
Fig. 3.
Phosphodiesterases and phosphatases control the baseline PKA activity at the RyR2 and SERCA2 nanodomains in AVMs. Rat AVMs expressing FKBP-AKAR3 and SR-AKAR3 were treated with drugs as indicated. A and B Time courses show the changes in YFP/CFP ratio before and after addition of inhibitor of PDE2 erythro-9-(2-Hydroxy-3-nonyl) adenine hydrochloride (EHNA 10 µmol/L), PDE3 (cilostamide, Clio, 1 µmol/L), PDE4 (rolipram, Roli, 10 µmol/L), or both Cilo and Roli. The maximal increases in YFP/CFP ratio before and after drug treatment were plotted. C and D Time courses show the changes in YFP/CFP ratio before and after addition of phosphatase inhibitor (1 nmol/L and 100 nmol/L, okadaic acid, OA) as indicated. The maximal increases in YFP/CFP ratio of FKBP-AKAR3 and SR-AKAR3 in AVMs after drug treatment were plotted. E and F co-treated with ISO (10 nmol/L) together with phosphatase inhibitor OA (100 nmol/L) as indicated. Time courses show the changes in YFP/CFP ratio before and after addition of drugs. The maximal increases in YFP/CFP ratio of FKBP-AKAR3 and SR-AKAR3 in AVMs before and after stimulation were plotted. Dot plots represent mean ± SEM of indicated number of AVMs from mice. p values were obtained by Student t-test between two groups or by one-way ANOVA analysis followed with Tukey’s multiple comparison test

