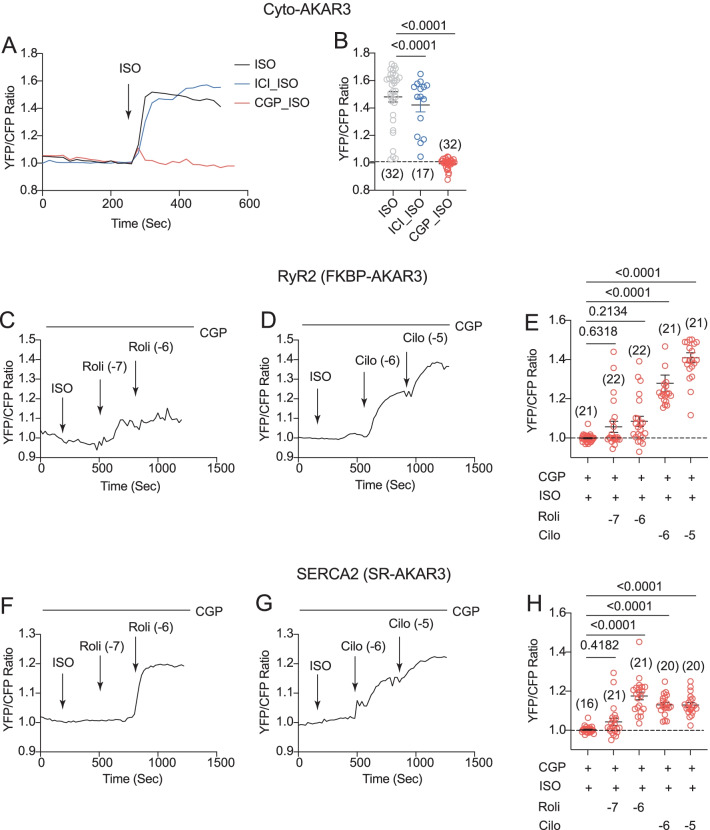
Fig. 4.
Phosphodiesterases restrict β2AR signaling at the RyR2 and SERCA2 nanodomains in AVMs. Rat AVMs expressing Cyto-AKAR3, FKBP-AKAR3, and SR-AKAR3 were treated with drugs as indicated. A and B Time courses show changes in YFP/CFP ratio of Cyto-AKAR3 in rat AVMs induced by ISO (100 nmol/L) after 5 min pretreatment of β1AR antagonist CGP (300 nmol/L) and β2AR antagonist ICI (100 nmol/L). The maximal changes in FRET ratio after drug treatment were plotted. C–E Time courses show changes in YFP/CFP ratio of FKBP-AKAR3 induced by ISO (100 nmol/L) after 5 min pretreatment with β1AR antagonist CGP (300 nmol/L), which was then followed with addition of inhibitor of PDE4 (Roli, 100 nmol/L and 1 µmol/L) and PDE3 (Cilo, 1 and 10 µmol/L) as indicated. The maximal changes in FRET ratio after drug treatment were plotted. F–H Time courses show changes in YFP/CFP ratio of SR-AKAR3 induced by ISO (100 nmol/L) after 5 min pretreatment with β1AR antagonist CGP (300 nmol/L), which was then followed with addition of inhibitor of PDE4 (Roli, 100 nmol and 1 µmol/L) and PDE3 (Cilo, 1 and 10 µmol/L) as indicated. The maximal changes in FRET ratio after drug treatment were plotted. Dot plots represent mean ± SEM of indicated number of AVMs from rats. p values were obtained by one-way ANOVA analysis followed with Tukey’s multiple comparison test

