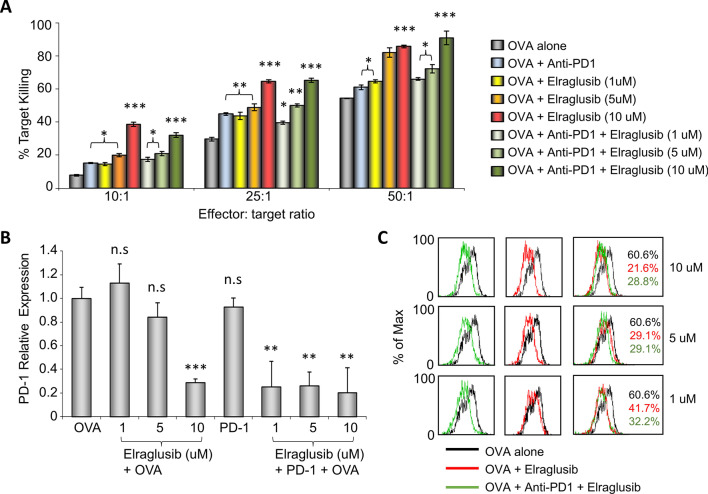
Fig. 2.
Elraglusib enhances antigen-specific CD8 + T cell cytolytic responses in vitro. A Cytolytic assay in response to OVA peptide in the presence of elraglusib (at the indicated concentrations) and/or anti-PD-1 mAb. B Quantitative real-time PCR of PD-1 transcription of CTLs treated with doses of elraglusib as indicated with/without anti-PD-1 mAb. C Flow cytometric profiles. Black line, non-treated CTLS; red line, with elraglusib; and green line, with elraglusib and anti-PD-1 mAb. Doses of elraglusib shown on the right. % of CTLs expressing PD-1 shown in black for non-treated cells; red for treatment with elraglusib; green for treatment with elraglusib and anti-PD-1. Statistical analysis based on triplicate values in individual experiments showing means and SDs (unpaired t test). *p < 0.05; **p < 0.01; ***p < 0.001; ns, no significant difference relative to controls (OVA alone). Data are represented as mean ± standard error of mean (SEM)

