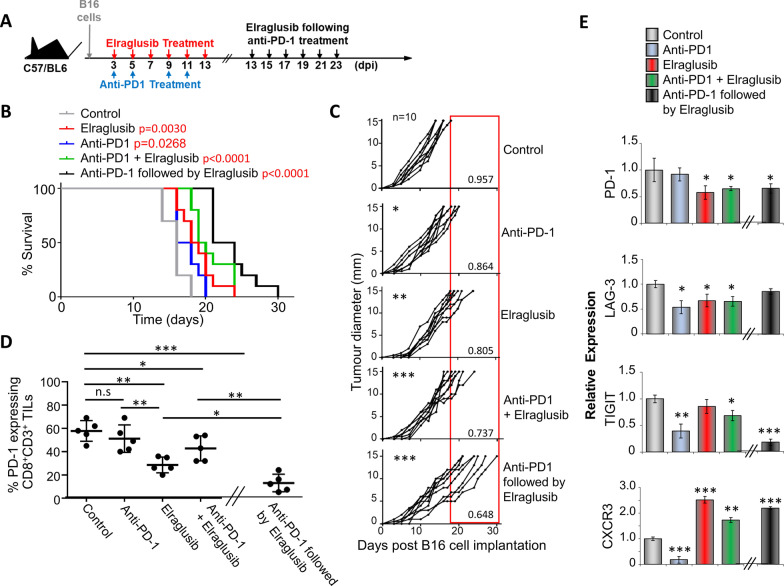
Fig. 3.
Sequential treatment of anti-PD-1 therapy followed by elraglusib significantly reduces growth of subcutaneously injected B16 melanoma. A Schematic representation of treatment regime. B Survival curves of mice with and without treatment as indicated (n = 10; total number of mice: 50). P values shown in Additional file 1: Table 1. C Tumour growth curves (n = 10 mice per condition). There was a significant difference between all groups when compared to the control. This difference was also observed when comparing the monotherapies with the sequential treatment (shown in red) but not when compared to the combined treatment. The numbers in the bottom corner indicate the average tumour growth rate represented as mm/day. D % of CD8 + CD3 + tumour infiltrating cells expressing PD-1 as determined by flow cytometry (n = 5). E Transcription of PD-1, LAG-3, TIGIT and CXCR3 in splenic CD8 + T cells from mice treated as shown. (B–C) Represent two pooled experiments (D-E) Data shown from one individual experiment, representative of two independent experiments. Samples taken at day 14 (after treatment with elraglusib, anti-PD-1 mAb or combined treatment) or day 24 (sequential treatment) groups are compared using unpaired t test. *p < 0.05, **p < 0.01, ***p < 0.001. Data are represented as mean ± SEM

