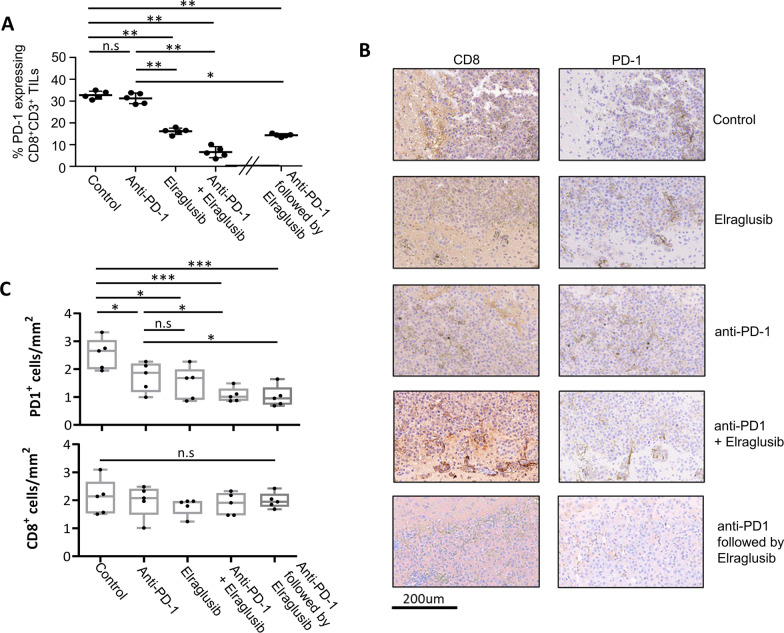
Fig. 5.
Tumour suppression by Elraglusib is associated with low numbers of PD-1 expressing tumour infiltrating T cells. A % of CD3 + CD8 + tumour infiltrating cells expressing PD-1 as determined by flow cytometry (n = 5). B Immunohistochemistry of brain tissue sections from B16 tumour bearing mice. Same samples as in Fig. 4D, taken at day 8 (after treatment with elraglusib, anti-PD-1 mAb or combined treatment) or day 14 (sequential treatment) as indicated to the right intra-tumoural areas are shown following staining for (left) CD8 + and (right) PD-1 + expression. C depicts number of positive cells quantified from 5 different areas using ImageScope software. Data representative of two independent experiments. Groups compared using unpaired t test. ***P < 0.0001; **P < 0.001; *P < 0.01; ns, no significant difference relative to controls

