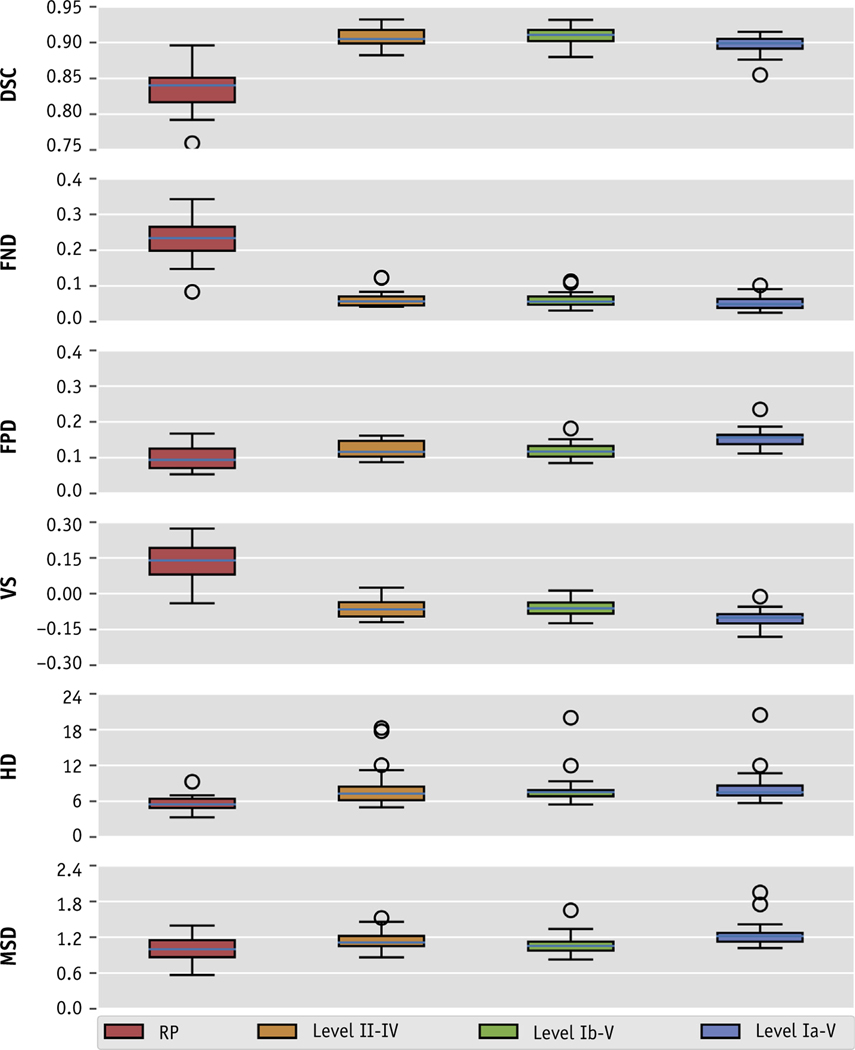
Fig. 2.
Box plot of the distributions of overlap and distance metrics in a comparison of the ground-truth and autosegmented volumes for each neck lymph node target volume. The boxplots are representative of individual metric’s interquartile range, whereas the whiskers denote values within 1.5 interquartile range, and the outliers (circles) are values that are found outside of this range. Abbreviations: DSC = dice similarity coefficient; FND = false negative dice; FPD = false positive dice; HD = hausdorff distance; MSD = mean Surface distance; VS = volume similarity.

