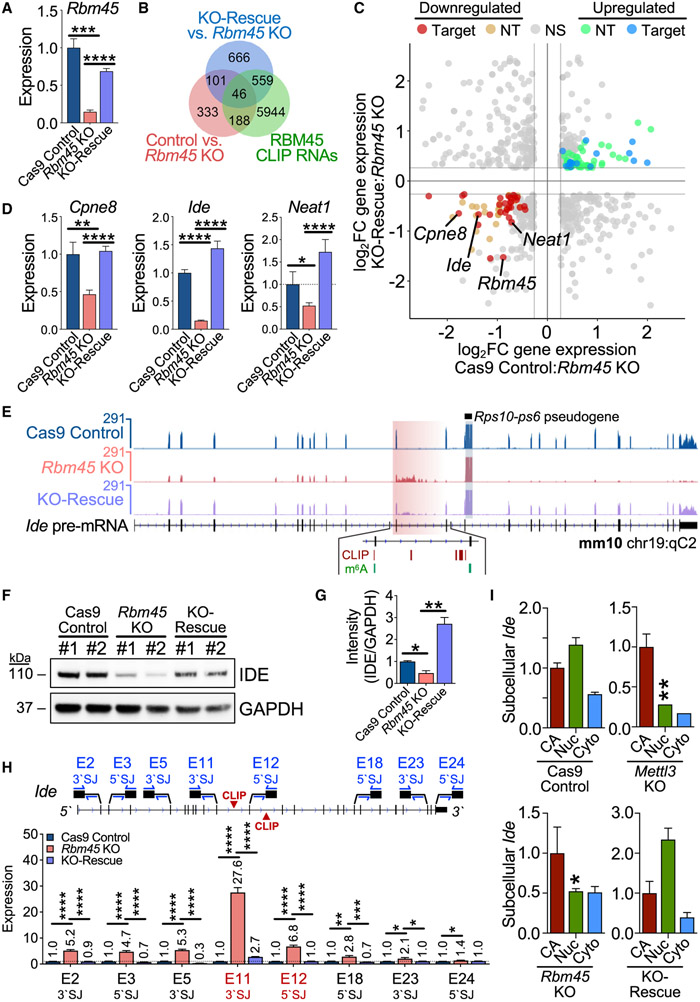
Figure 3. RBM45 regulates target RNA expression in mHippoE-2 cells.
(A) Rbm45 levels in Cas9 control, Rbm45 KO, and KO-rescue mHippoE-2 cells. Mean ± SEM from 3 biological replicates plotted. Statistical significance calculated using a Welch’s t test. ***p = 3.0 × 10⁻⁴, ****p < 1.0 × 10⁻⁶.
(B) Venn diagram shows a subset of differentially expressed RNAs (adjusted p value [padj[ ≤ 0.05, ∣log2FC∣≥log2(1.2)) bound by RBM45 in mHippoE-2 cells.
(C) Scatterplot of significant (padj ≤ 0.05) differential gene-expression changes (∣log2FC∣≥log21.2) between Cas9 control and Rbm45 KO mHiPPoE-2 cells (x axis) or Rbm45 KO and KO-rescue mHiPPoE-2 cells (y axis). Blue, up-regulated CLIP targets, green; up-regulated non-target (NT) RNAs; red, down-regulated CLIP targets; orange, down-regulated NT RNAs. Targets (Cpne8, Ide, and Neat1) chosen for validation in (D) are labeled alongside Rbm45.
(D) Relative expression of Cpne8, Ide, and Neat1 mRNAs in Cas9 control, Rbm45 KO, and KO-rescue mHippoE-2 cells. Mean ± SEM from 3 biological replicates plotted. Significance calculated using a Welch’s t test; *p ≤ 0.05, **p ≤ 0.01, ****p ≤ 1.0 × 10⁻⁴.
(E) RNA-seq alignments for Ide in Cas9 control, Rbm45 KO, and KO-rescue mHippoE-2 cells. RBM45 CLIP peaks and m6A sites are indicated.
(F) Western blot shows an RBM45-dependent effect on IDE expression in mHippoE-2 cells. Results represent 5 biological replicates.
(G) Densitometry quantification of differential IDE expression in (F). Mean ± SEM plotted; significance determined using a Welch’s t test; *p < 0.05, **p < 0.01.
(H) qRT-PCR quantification along the Ide pre-mRNA using primer pairs targeting 5′ or 3′ splice junctions (SJs). The exon 11 3′ SJ and exon 12 5′ SJ flank intron 11, where RBM45 binds. Mean ± SEM from 3 biological replicates plotted. Significance calculated using an adjusted Welch’s t test (Holm-Sidak); *p ≤ 0.05, **p ≤ 0.01, ***p ≤ 1.0 × 10⁻³, ****p ≤ 1.0 × 10⁻⁴.
(I) Ide expression in CA, Nuc, and Cyto RNA from mHiPPoE-2 cell lines. Mean ± SEM from 3 biological replicates is plotted; expression normalized to Cas9 control cells. Significance calculated by adjusted two-way ANOVA (Tukey’s); *p ≤ 0.05, **p ≤ 0.01.
See also Figure S4.

