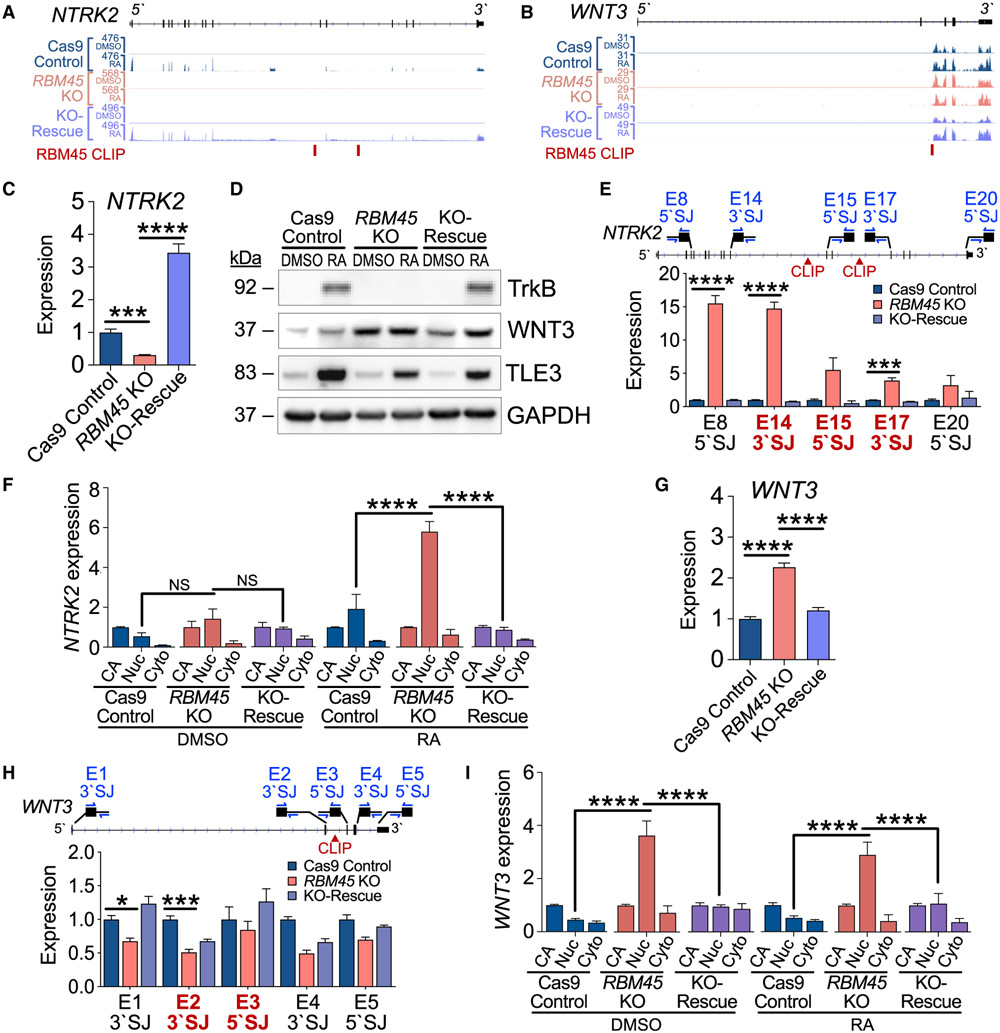
Figure 6. RBM45 regulates splicing of neurodevelopmental target RNAs.
(A) RNA-seq alignments for NTRK2 in SH-SY5Y cell lines.
(B) RNA-seq alignments for WNT3 in SH-SY5Y cell lines.
(C) NTRK2 expression by qRT-PCR in untreated SH-SY5Y cell lines. Significance calculated using an adjusted Welch’s t test (Holm-Sidak); ***padj = 3.6 × 10⁻⁴, ****Padj ≤ 1.0 × 10⁻⁶.
(D) Expression of RBM45 targets TrkB, TLE3, and WNT3 in DMSO- and RA-treated SH-SY5Y cell lines. Data represent 4 biological replicates.
(E) Relative expression along the length of the NTRK2 pre-mRNA using qRT-PCR with primer pairs targeting 5′ or 3′ SJs. Exon-intron junctions flanking RBM45 target introns are bold red. Mean ± SEM from 3 biological replicates. Significance calculated using an adjusted Welch’s t test (Holm-Sidak); ***p ≤ 1.0 × 10⁻³, ****p ≤ 1.0 × 10⁻⁴.
(F) Expression of NTRK2 RNA by qRT-PCR in subcellular fractions from DMSO- and RA-treated SH-SY5Y cells. Expression normalized to CA-RNA within genotypes. Mean ± SEM from 2 biological replicates. Significance calculated by two-way ANOVA; ****p ≤ 1.0 × 10⁻⁴.
(G) WNT3 expression by qRT-PCR in SH-SY5Y cell lines. Significance calculated using an adjusted Welch’s t test (Holm-Sidak); ****padj = 7.0 × 10⁻⁶.
(H) Relative expression of unspliced WNT3 pre-mRNA measured by qRT-PCR with primer pairs targeting 5′ or 3′ SJs along the length of the pre-mRNA. Exon-intron junctions flanking target introns are bold red. Mean ± SEM from 3 biological replicates. Significance calculated using an adjusted Welch’s t test (Holm-Sidak); *p ≤ 0.05, ***p ≤ 1.0 × 10⁻³.
(I) Expression of WNT3 RNA by qRT-PCR in subcellular fractions from DMSO- and RA-treated SH-SY5Y cells. Expression normalized to CA-RNA within genotypes. Mean ± SEM from 2 biological replicates plotted. Significance calculated by two-way ANOVA; ****p ≤ 1.0 × 10⁻⁴.
See also Figure S6.

