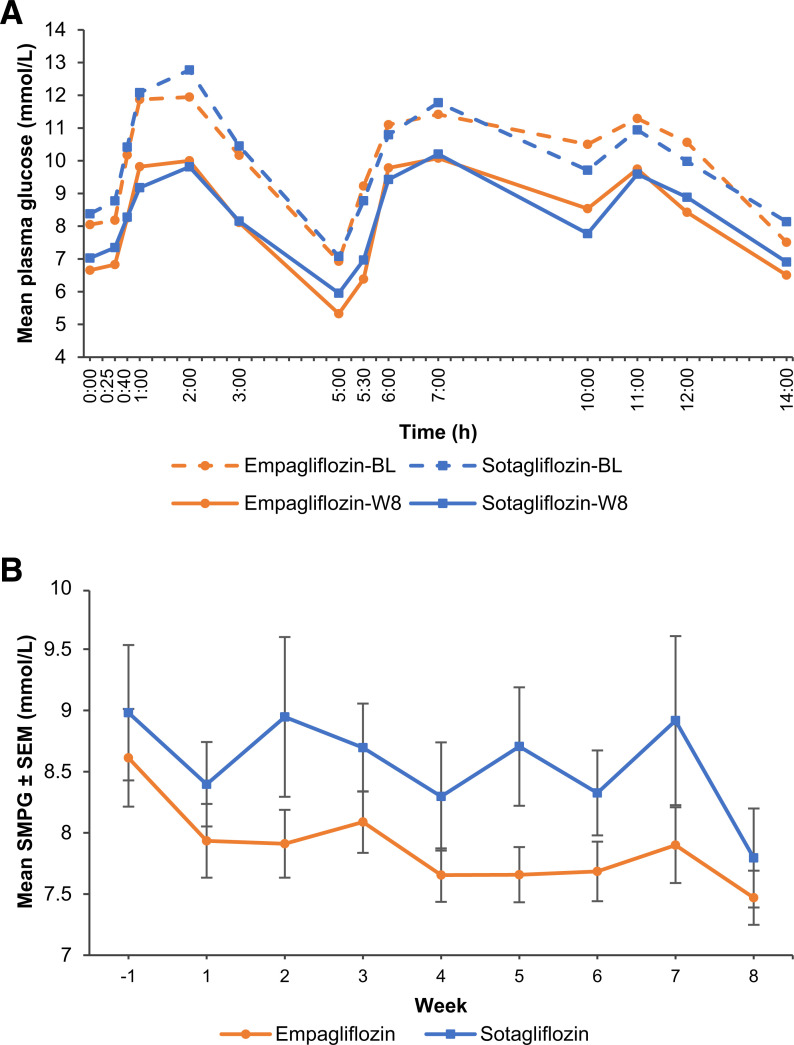
Figure 2.
A: Time course of mean plasma glucose concentrations during the 14 h in-house period before and after 8 weeks of treatment with sotagliflozin 400 mg or empagliflozin 25 mg. B: Weekly mean SMPG results from baseline (week −1) to week 8. Error bars represent SEM. BL, baseline (day −1); W8, end of treatment (day 56).

