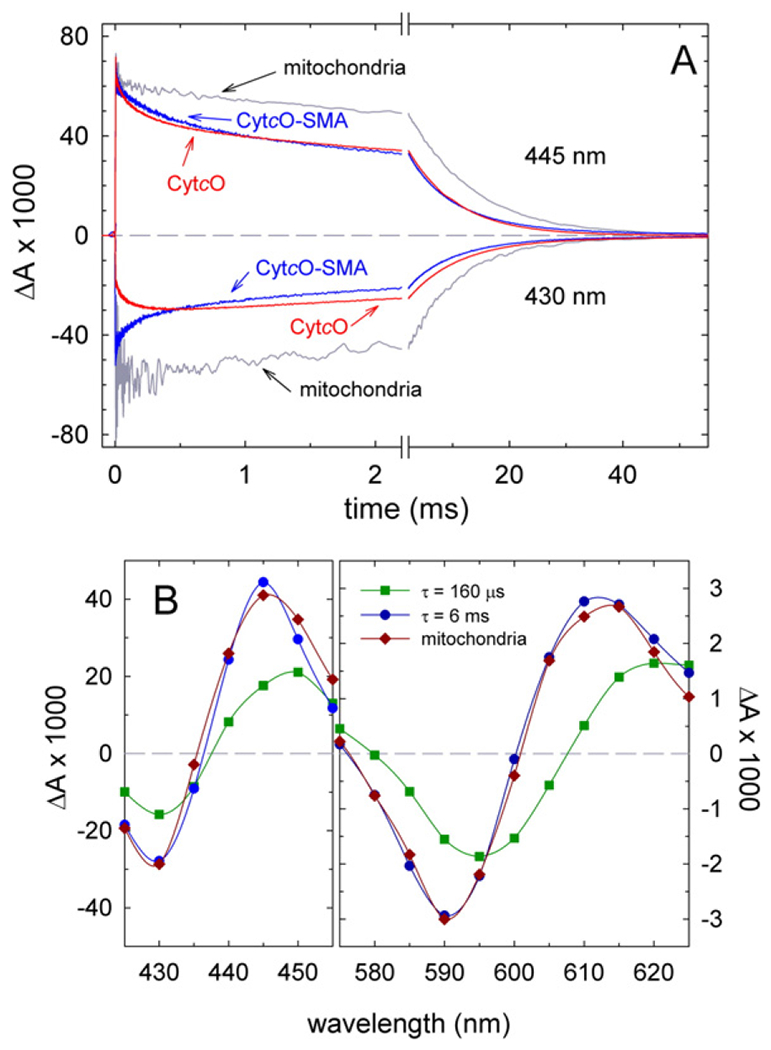
Fig. 4.

Absorbance changes after the flash-induced dissociation of CO from fully reduced samples. (A) Absorbance changes as a function of time at 445 nm and 430 nm (above and below the zero (dashed) line, respectively, as indicated in the graph) after flash-induced dissociation of CO (at t = 0). The traces represent: CytcO-SMA (blue), yeast mitochondria (grey) and yeast CytcO in DDM (red). Experimental conditions: 0.2 M NaCl, 20 mM HEPES (pH 8.0) for CytcO-SMA; 60 mM sorbitol, 20 mM HEPES (pH 7.4) for yeast mitochondria and 0.15 M KCl, 20 mM HEPES (pH 8.0), 0.05% DDM, 10% glycerol for detergent-solubilized CytcO. The temperature was ~22 °C. All amplitudes are normalized to 1 μM reactive enzyme. (B) Kinetic difference spectra for CytcO-SMA native nanodiscs. Amplitudes of the fast and the slow components of CO-recombination kinetic traces are plotted as a function of wavelength and shown in dark green (squares) and dark blue (circles), respectively. The sum of the amplitudes of these two components at 445 nm has been normalized to 1 μM reacting CytcO. A kinetic difference spectrum (CO-reduced – minus – reduced) of the major component (90%, τ ≅ 9 ms) in yeast CytcO in native mitochondria is shown for comparison (dark red diamonds). This difference spectrum is normalized to approximately overlap with the slow component (dark blue circles). Time constants and contributions of the kinetic components were determined using the software ProK (global fit).
